

The effects of space radiation on the transcriptome of heart right ventricle tissue
- PMID: 40691149
- PMCID: PMC12280083
- DOI: 10.1038/s41526-025-00506-8
The effects of space radiation on the transcriptome of heart right ventricle tissue
Abstract
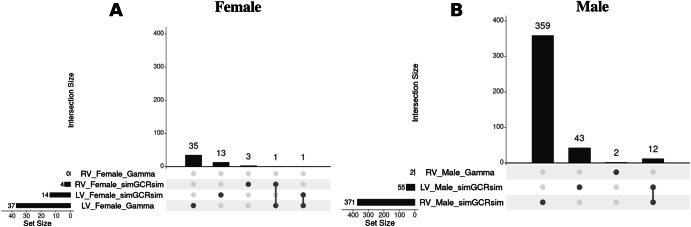
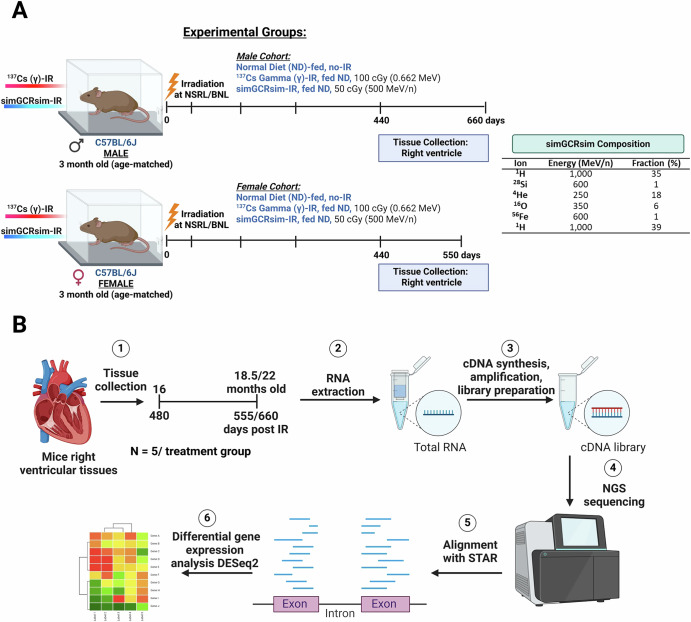
Deep space represents a challenging environment for human exploration and can be accompanied by harmful health-related risks. We aimed to assess the effect of simplified galactic cosmic ray simulated (simGCRsim) and gamma (γ) ionizing radiation (IR) on transcriptome changes in right ventricular (RV) tissue after a single low dose (0.5 Gy, 500 MeV/nucleon) full body exposure in C57BL/6J male and female mice. In females, no differentially expressed genes (DEGs) and only 2 upregulated genes in males exposed to γ-IR were revealed. In contrast, exposure to simGCRsim-IR resulted in 4 DEGs in females and 371 DEGs in males, suggesting longer-lasting and sex-biased DEGs after simGCRsim-IR. Overrepresentation analysis of DEGs in simGCRsim-IR males revealed significant enrichment in pathways related to muscle contraction, hypertrophic cardiomyopathy, oxytocin release, the regulation of cytoskeleton, and genes associated with Alzheimer's, Huntington's, and Parkinson's diseases. Our results suggested the RV transcriptome exhibits distinct responses after exposure based on both the IR and sex.
© 2025. The Author(s).
Conflict of interest statement
Competing interests: The authors declare no competing interests.
Figures


Similar articles
-
Long-lasting sex-specific alteration in left ventricular cardiac transcriptome following gamma and simGCRsim radiation.Sci Rep. 2025 Feb 18;15(1):5963. doi: 10.1038/s41598-025-89815-2. Sci Rep. 2025. PMID: 39966642 Free PMC article.
-
The Role and Mechanism of Anti-ICOS mAb in Experimental Autoimmune Encephalomyelitis.Immunology. 2025 Jun 30. doi: 10.1111/imm.70014. Online ahead of print. Immunology. 2025. PMID: 40589140
-
[Analysis of the number, type, and functional heterogeneity of senescent cells in the radiation-induced skin wounds in mice].Zhonghua Shao Shang Yu Chuang Mian Xiu Fu Za Zhi. 2025 Jun 20;41(6):577-586. doi: 10.3760/cma.j.cn501225-20240604-00209. Zhonghua Shao Shang Yu Chuang Mian Xiu Fu Za Zhi. 2025. PMID: 40588406 Free PMC article. Chinese.
-
Vitamin C for asthma and exercise-induced bronchoconstriction.Cochrane Database Syst Rev. 2013 Oct 23;2013(10):CD010391. doi: 10.1002/14651858.CD010391.pub2. Cochrane Database Syst Rev. 2013. PMID: 24154977 Free PMC article.
-
Discontinuation of intravenous oxytocin in the active phase of induced labour.Cochrane Database Syst Rev. 2018 Aug 20;8(8):CD012274. doi: 10.1002/14651858.CD012274.pub2. Cochrane Database Syst Rev. 2018. PMID: 30125998 Free PMC article.
References
-
- Levine, B. D. et al. Maximal exercise performance after adaptation to microgravity. J. Appl. Physiol. (1985)81, 686–694 (1996). - PubMed
Grants and funding
- HL164794/National Institute of Health R01 grant
- 80NSSC19K1079/NASA Human Research Program
- 23-24U1/American Thoracic Society Research Program
- K01 HL159038/HL/NHLBI NIH HHS/United States
- R01 HL164794/HL/NHLBI NIH HHS/United States
- 24CDA1269532/American Heart Association Career Development Award
- 23TPA1140823/American Heart Association Transformational Project Award
- R25 HL146166/HL/NHLBI NIH HHS/United States
- K01HL159038-01A1/National Institutes of Health/National Heart, Lung, and Blood Institute (NIH/NHLBI)
- 25FAST-1F004/ADVANCE Research Grant funded by the Foundation for Armenian Science and Technology and Research Grant
- 23IPA105444/Innovative Project Award
LinkOut - more resources
Full Text Sources
