. 2025 Jul 21;16(1):6695.
doi: 10.1038/s41467-025-62073-6.

A UFD1 variant encoding a microprotein modulates UFD1f and IPMK ubiquitination to play pivotal roles in anti-stress responses

Affiliations

A UFD1 variant encoding a microprotein modulates UFD1f and IPMK ubiquitination to play pivotal roles in anti-stress responses

Xiuzhi Li et al. Nat Commun. .

Abstract

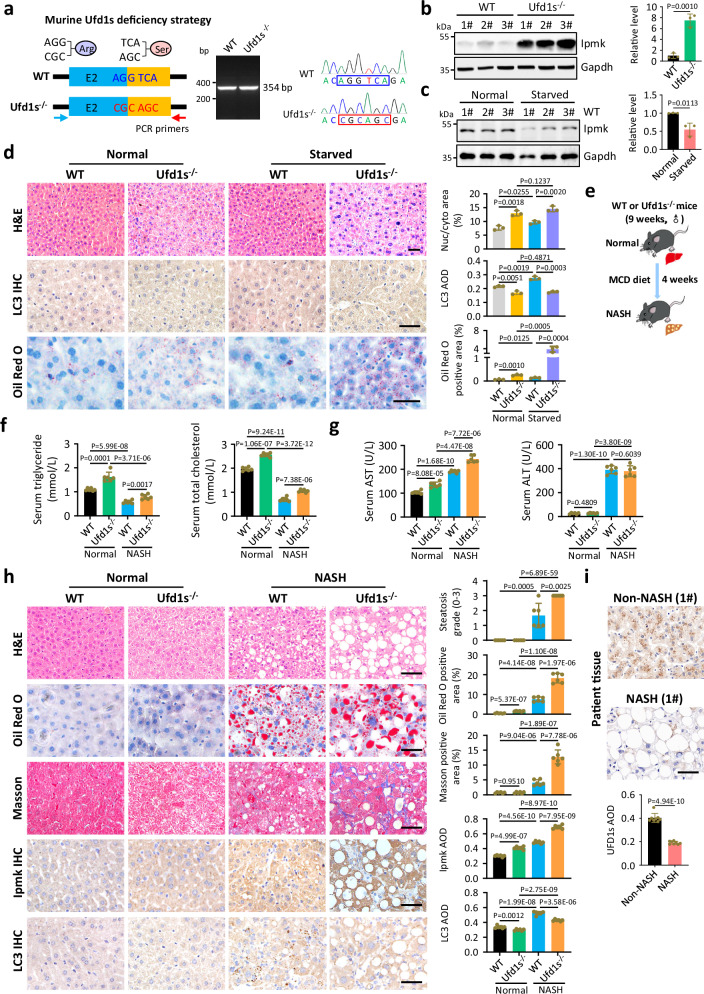
Eukaryotic cells make multiple efforts to cope with internal and external stresses; such mechanisms include metabolic responses and the generation of stress-responsive mRNA isoforms (SR-mRNAisos), such as the classical XBP1s. Here, we identified a mammalian conserved SR-mRNAiso, UFD1s, which encodes a microprotein with anti-stress functions. UFD1s decreased the K63-linked ubiquitination levels of UFD1 full-length protein (UFD1f) via competitive binding to the E3 ubiquitin ligase MARCH7, and therefore regulated the dynamics of protein ubiquitination. Inositol polyphosphate multikinase (IPMK) was identified as the most significantly UFD1s-regulated target in terms of changes in K48- and K11-ubiquitination. UFD1s promoted autophagy and fatty acid oxidation, and IPMK was consistently destabilized. Ufd1s-deficient male mice exhibited metabolic disorders and accelerated NASH progression. Plasmid or circRNA expressing UFD1s alleviated NASH in mice, indicating that UFD1s has therapeutic value. Our findings revealed a mammalian conserved microprotein that plays crucial roles in anti-stress regulation through the modulation of ubiquitination and metabolism.


Conflict of interest statement

Competing interests: The authors declare the following patent application related to this work. Patent applicants: Institute of Health and Medicine, Hefei Comprehensive National Science Center; University of Science and Technology of China. Inventors: G.S., X.Li., X.W. (co-authors of this article); Application number: CN 2024114540916; Status: Pending; The patent claims cover the application of small protein UFD1s for the prevention, treatment, and diagnosis of diseases, including NASH. The remaining authors declare no competing interests.

Figures

Fig. 1
Fig. 1. Stress-responsive UFD1 variant (UFD1s) encodes a microprotein in mammals.
a Schematic illustration for identification of conserved stress-responsive mRNA isoforms (SR-mRNAisos). Briefly, split reads were aligned to reference genomes with at least a 5-nt overhang and correspondent split junctions were considered as splicing events. Differentially expressed splicing events (DESEs) were subjected to alignment of extended 20-nt sequences of split junctions between human and mice for conservation analysis. (see “Methods” for details). b Venn diagram revealing the overlap of differential splicing isoforms in human HEK293T and mouse N2a cells under two kinds of cellular stresses (TG and GD). XBP1s and UFD1s were identified as the two most conserved SR-mRNAisos among the 27 SR-mRNAisos with identity over 50% between human and mouse. TG thapsigargin, GD glucose deprivation. c RNA-seq signals of the UFD1 gene in HEK293T and N2a cells under REG, TG, and GD treatments. Exon 2b is a previously unrecognized 5′ alternative spliced exon. The numbers above/below the connected lines indicate split reads. RPM read per million, REG regular medium. d RT-qPCR analysis of UFD1s RNA levels in HEK293T cells treated with indicated RBP shRNAs under TG treatment. shCOO2, shRNA control with scrambled sequences. e Representative semi-quantitative RT-PCR images of UFD1 and XBP1 isoforms in HEK293T and N2a cells after TG or GD treatments (three independent experiments). ACTB (β-actin mRNA) was used as a loading control. UFD1f, full-length UFD1; UFD1s, spliced UFD1; XBP1u, unspliced XBP1; XBP1s, spliced XBP1. f Representative smFISH images, quantification (N = 15 cells) and nuclear/cytoplasmic ratio revealing levels and localization of UFD1s (green) and UFD1f (red) RNAs in HEK293T cells. Nuclei (blue) were stained with DAPI. Scale bar, 10 μm. g Alignment of the predicted UFD1s-ORF and UFD1f in human and mice. C-terminal regions of UFD1s proteins are the antigens for anti-UFD1s antibodies. h Western blotting revealing endogenous UFD1s protein levels in HEK293T or N2a cells after TG and GD treatments. i Representative immunofluorescence (IF) staining and quantification (N = 15 cells) of UFD1s (red) or UFD1f (green) proteins in HEK293T and N2a cells after TG treatment. Scale bar, 10 μm. In (d, h), data from three independent experiments; in (f, i), data from 15 cells, data are shown as mean ± SEM. P values were calculated by two-tailed Student′s t-test. Source data are provided as a Source Data file.
Fig. 2
Fig. 2. UFD1s protein exhibits anti-stress effects and regulates autophagy and lipid metabolism.
a Schematic diagram for UFD1s deficiency (MUT) mediated by CRISPR/Cas9 to change the alternative 5′ splice site (A5SS) from AGGTCA to CGCAGC in HEK293T and N2a cells, which is synonymous mutations for UFD1f protein. PCR-based genotyping primers were indicated, and mutations were further confirmed by Sanger sequencing. WT wild-type. b The UFD1s and UFD1f protein levels in WT and UFD1s MUT HEK293T cells. Western blotting images and the corresponding quantification are shown. Total ROS (c) and ATP (d) levels in WT or UFD1s MUT HEK293T and N2a cells under GD treatments, with or without UFD1s overexpression. EV empty vector, UFD1s OE Flag-tagged UFD1s overexpression, GD glucose deprivation. e Cell survival measured via PI/Hoechst staining in WT or MUT HEK293T and N2a cells. Cells were under GD treatment, with or without UFD1s overexpression. OCR (oxygen consumption rate) curves of HEK293T UFD1s deficiency (MUT) and WT cells (f) and in HEK293T cells with or without UFD1s overexpression (g). Different respiration parameters of mitochondria are shown with bar graph. BR basal respiration, ALR ATP-linked respiration, MR maximal respiration, PLR proton leak respiration. h Heatmap showing the 79 differentially expressed (DE) mRNAs between the MUT and WT cells, with consistent up- or downregulated direction under both REG and GD conditions. i Gene Ontology (GO) analysis revealing biological processes of the 79 DE mRNAs. The number of mRNAs belonging to the corresponding GO term is included in the brackets. j Transmission electron microscopy (TEM) to examine autophagy of cells under REG, chloroquine (CQ), or HBSS starvation treatments. The number of AVs per cell (N = 5 cells) and the diameter of AVs (N = 10 AVs) are shown as bar and scatter dot charts, respectively. AVs autophagic vacuoles, HBSS Hank′s balanced salt solution. Scale bar, 1 μm. k Representative images and quantification (N = 25 cells) of mCherry-EGFP-LC3 expressed in WT and MUT HEK293T cells under nutrient-rich conditions and after 4 h HBSS starvation. Red-only puncta are quantified. Scale bar, 10 μm. l Representative images and quantification (N = 30 cells) of Nile red staining in WT and MUT HEK293T cells. Scale bar, 10 μm. m Seahorse XF assays performing OCR in WT or MUT HEK293T cells treated with or without the addition of exogenous fatty acids (PA). Basal OCR levels during the first 35 min are shown (right). OCR oxygen consumption rate, PA palmitate. In (bg, m), data from three independent experiments; in (j), data from 5 cells and 10 autophagic vacuoles; in (k, l), data from 25 and 30 cells, data are shown as mean ± SEM. P values were calculated by two-tailed Student′s t-test. Source data are provided as a Source Data file.
Fig. 3
Fig. 3. UFD1s modulates K63-polyubiquitination of UFD1f via competitively binding to MARCH7.
Ubiquitination of UFD1f examined by western blotting with α-total, K48-, K11-, K63-, and K6-linked polyubiquitin antibodies in WT or MUT cells. HEK293T cells (a) and N2a cells (b). (Ub)n, polyubiquitin. c, d Total, K48-, K11-, K63-, and K6-linked ubiquitination of UFD1f with or without UFD1s overexpression. HEK293T cells (c) and N2a cells (d). e E3 ubiquitin ligases co-immunoprecipitated by UFD1s and UFD1f. IP-MS immunoprecipitation followed by mass spectrometry. f Interactions between HA-tagged MARCH7 and UFD1f in HEK293T and N2a cells upon UFD1s deficiency (MUT) or overexpression (OE), examined by co-IP. g Total and K63-linked ubiquitination of UFD1f in HEK293T and N2a cells upon MARCH7 knockdown. ShCOO2, shRNA control with scrambled sequences. h Experimental procedure for a two-step IP assay (Re-IP) followed by MS to identify K63-ubiquitinated sites of UFD1f in HEK293T cells. i K63-ubiquitination detection of overexpressed Flag-tagged UFD1f in HEK293T cells. Flag-tagged wild-type, UFD1fK240R, or UFD1fK240R/K280R UFD1f was overexpressed. HA-K63Ub, a plasmid expressing HA-tagged ubiquitin that can only form K63-linked ubiquitination. All quantifications (Quan.) are normalized to the immunoprecipitated UFD1f, and quantitative data from three independent experiments are shown as mean ± SEM. P values were calculated by two-tailed Student′s t-test. Source data are provided as a Source Data file.
Fig. 4
Fig. 4. UFD1s regulates ubiquitination dynamics of proteins, including IPMK and IPMK is regulated by UFD1f and MARCH7.
a Schematic workflow of ubiquitin-modified proteome. Briefly, ubiquitin tags of total proteins were digested to yield di-glycine (GG) linked to K, and then K-GG-modified peptides were subjected to IP-MS (see “Method” for details). b Volcano plots illustrating changes of ubiquitination levels of individual proteins in MUT versus WT HEK293T cells. Red or blue dots represent proteins with statistically significantly up or downregulated ubiquitination levels. IPMK has the most increased ubiquitination levels in MUT as compared to WT cells. c GO analysis of 178 proteins with significantly upregulated ubiquitin levels in MUT HEK239T cells. d Western blotting revealing IPMK protein levels in WT and MUT HEK293T or N2a cells treated with or without 20 μg/mL cycloheximide (CHX) for 4 h. Total, K48-, K11-, and K63-linked ubiquitination levels of IPMK in WT and MUT HEK293T (e) or N2a (f) cells. g UFD1f IP could co-IP IPMK in HEK293T cells. h IPMK protein levels in HEK293T cells expressing Flag-tagged UFD1f WT or K240R/K280R double mutant. i K48- and K11-polyubiquitination levels of IPMK in HEK293T cells under the overexpression of Flag-tagged UFD1f WT or K240R/K280R double mutant. j Western blotting revealing IPMK protein levels in HEK293T and Hepa1-6 cells after MARCH7 knockdown. k K48- and K11-polyubiquitination levels of IPMK in HEK293T and Hepa1-6 cells upon MARCH7 knockdown. ShCOO2, shRNA control with scrambled sequences. For (d, h, j), quantification was normalized to ACTIN levels; for (e, f, i, k), quantification was normalized to the immunoprecipitated IPMK levels. Data from three independent experiments are shown as mean ± SEM. P values were calculated by two-tailed Student′s t-test. Source data are provided as a Source Data file.
Fig. 5
Fig. 5. IPMK contributes significantly to UFD1s phenotypes.
Representative LC3 IF staining in WT and MUT HEK293T (a) or N2a (b) cells upon IPMK knockdown, with or without CQ treatment. Quantification of LC3 puncta per cell (N = 30 cells) is shown. ShCOO2, shRNA control with scrambled sequences. Scale bar, 10 μm. Representative Nile red staining in WT and MUT HEK293T (c) and N2a (d) cells upon IPMK knockdown. Quantification of LDs per cell (N = 30 cells) is shown. Scale bar, 10 μm. FAO rate examined by OCR in WT and MUT HEK293T (e) and N2a (f) cells with or without IPMK knockdown. OCR oxygen consumption rate, PA palmitate. g Western blotting revealing p-AMPK, AMPK, PGC1-1α, PPARα, and IPMK protein levels in HEK293T and N2a cells after IPMK knockdown. p-AMPK, phosphorylated AMPK. h Representative PGC1-1α and PPARα IF images in HEK293T and N2a cells after IPMK knockdown. Quantification (N = 30 cells) of PGC1-1α (green) and PPARα (red) proteins in HEK293T and N2a cells is shown. Scale bar, 10 μm. ShCOO2, shRNA control with scrambled sequences. Data from three independent experiments are shown as mean ± SEM. P values were calculated by two-tailed Student′s t-test. Source data are provided as a Source Data file.
Fig. 6
Fig. 6. Ufd1s-deficiency leads to liver defects and exacerbates NASH progression.
a Strategy of CRISPR/Cas9-mediated Ufd1s-deficient (Ufd1s−/−) mice. Genotyping primers and the representative PCR image are shown (three independent experiments), PCR products were further confirmed by Sanger sequencing. b Ipmk protein levels in WT and Ufd1s−/− mouse livers (N = 3 mice). c Ipmk protein levels of WT mouse livers under normal or 24 h-starved conditions (N = 3 mice). d Representative H&E staining, LC3 immunohistochemistry (IHC) and Oil Red O staining images of liver sections from WT or Ufd1s−/− mice (N = 3 mice) under normal or 24 h-starved conditions. Nuclear (Nuc)/cytoplasmic (Cyto) area ratio (%) was measured based on H&E staining. AOD average optical density, scale bar, 50 μm. e Schematic illustration of inducing NASH mice model with the methionine and choline-deficient diet (MCD). Serum triglycerides, total cholesterol (f), aspartate aminotransferase (AST), and alanine aminotransferase (ALT) (g) levels of WT and Ufd1s−/− mice (N = 6 mice), under normal or NASH conditions. h Representative images and quantification of H&E, Oil Red O, Masson staining, Ipmk, and LC3 IHC of liver sections of WT or Ufd1s−/− mice (N = 6 mice), under normal or NASH conditions. Scale bar, 50 μm. i Representative UFD1s IHC images and quantification in liver sections from clinic non-NASH and NASH specimens (N = 8 clinic specimens). Images from 1 of the 8 non-NASH and NASH specimens are shown, and images from the other specimens are demonstrated in Supplementary Fig. 8i. Scale bar, 50 μm. The number of mice or clinic specimens is denoted by N; data are shown as mean ± SEM. P values were calculated by two-tailed Student′s t-test. Source data are provided as a Source Data file.
Fig. 7
Fig. 7. Application of Ufd1s-coding plasmid or circRNA alleviates NASH progression.
a Two strategies, plasmid and circRNA, to express Ufd1s protein in NASH mice. b Representative Ufd1s IHC images and quantification in liver sections of NASH mice (N = 6 mice) with pLIVE, pLIVE-Ufd1s, circUfd1sATG-ATT, and circUfd1s injection. pLIVE plasmid vector control, circUfd1sATG-ATT circUfd1s with start codon mutation from ATG to ATT. Scale bar, 50 μm. Serum triglycerides, total cholesterol (c), AST and ALT (d) levels of NASH mice (N = 6 mice). e Representative images and quantification of H&E, Oil Red O, Masson staining, Ipmk, and LC3 IHC of liver sections (N = 6 mice). Scale bar, 50 μm. Data from 6 mice are shown as mean ± SEM. P values were calculated by two-tailed Student′s t-test. Source data are provided as a Source Data file.
Fig. 8
Fig. 8
Schematic diagram of functions and functional mechanisms of UFD1s in anti-stress responses.

Similar articles

References

    1. Galluzzi, L., Yamazaki, T. & Kroemer, G. Linking cellular stress responses to systemic homeostasis. Nat. Rev. Mol. Cell Biol.19, 731–745 (2018). - PubMed
    1. Maxwell, B. A. et al. Ubiquitination is essential for recovery of cellular activities after heat shock. Science372, eabc3593 (2021). - PMC - PubMed
    1. Pakos-Zebrucka, K. et al. The integrated stress response. EMBO Rep17, 1374–1395 (2016). - PMC - PubMed
    1. Kevei, É. & Hoppe, T. Ubiquitin sets the timer: impacts on aging and longevity. Nat. Struct. Mol. Biol.21, 290–292 (2014). - PubMed
    1. Hetz, C., Chevet, E. & Harding, H. P. Targeting the unfolded protein response in disease. Nat. Rev. Drug Discov.12, 703–719 (2013). - PubMed

Substances

LinkOut - more resources