

Development and validation of a nomogram model to predict postoperative delirium after resection of esophageal cancer
- PMID: 40691213
- PMCID: PMC12280112
- DOI: 10.1038/s41598-025-11255-9
Development and validation of a nomogram model to predict postoperative delirium after resection of esophageal cancer
Abstract
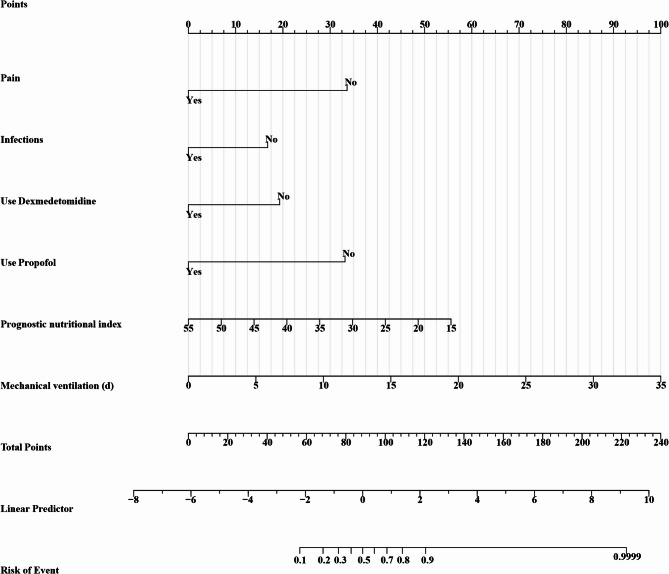
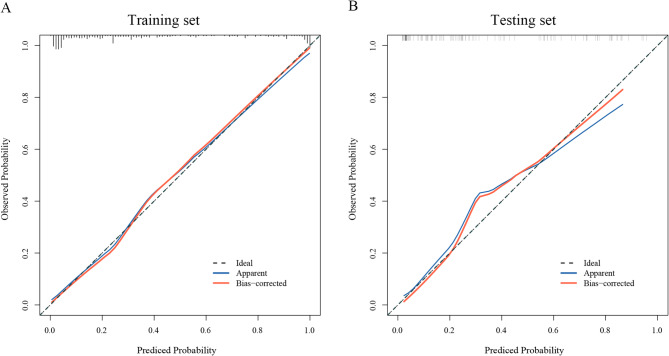
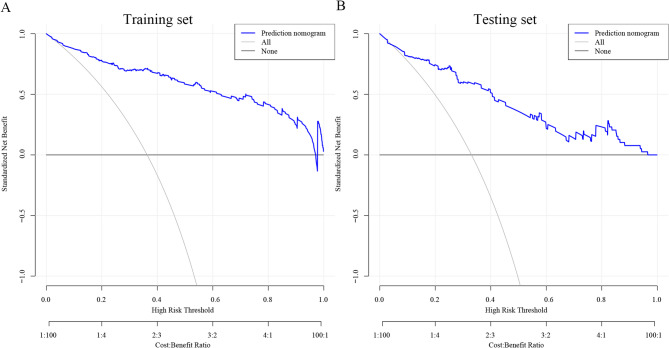
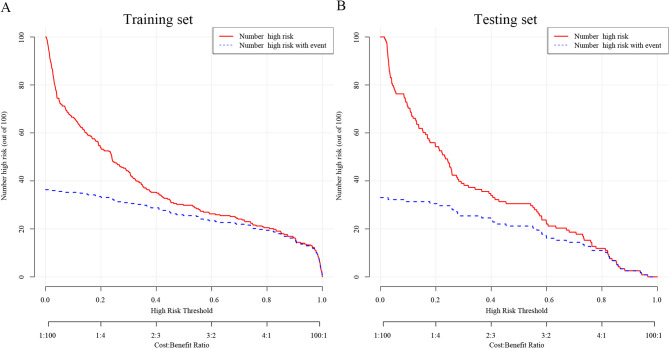
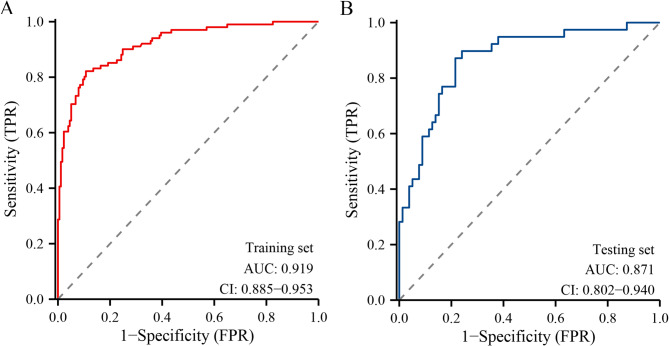
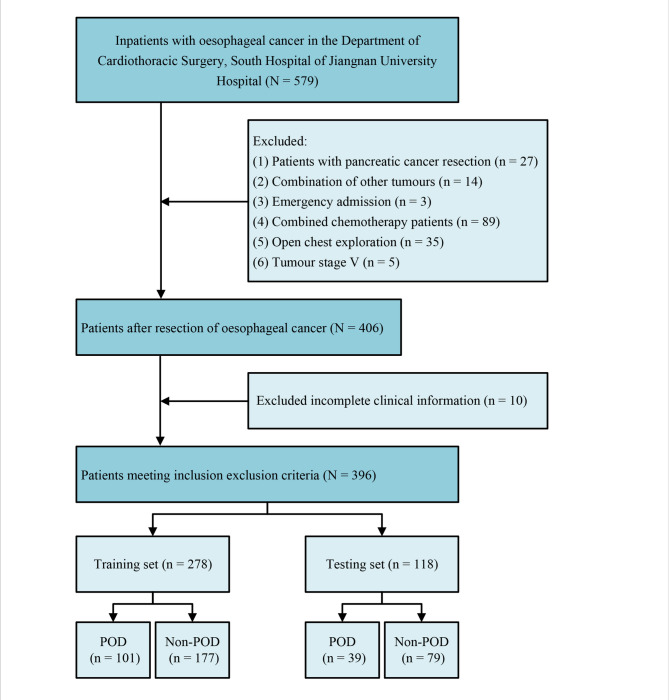
The study aimed to establish and validate a nomogram model to predict postoperative delirium (POD) among esophageal cancer resection patients. Clinical data of 396 patients with esophageal cancer who underwent esophagectomy from November 2020 to June 2023 in the electronic medical records of cardiothoracic Surgery, Affiliated Hospital of Jiangnan University. Participants were randomly divided into training and testing sets in a 7:3 ratio. Predictors were screened by Least absolute shrinkage and selection operator (LASSO) regression analysis and a nomogram model was built. The discrimination and consistency of the model were evaluated using the area under the receiver operating characteristic curve (AUC), C-statistic, Brier score, Hosmer-Lemeshow goodness-of-fit test, calibration curve and decision curve analysis (DCA). The results were validated using 1000 bootstraps resampling internal validation and testing set. Among 32 potential predictors, the final prediction model included 6 variables: postoperative pain, postoperative infection, dexmedetomidine use, propofol use, duration of mechanical ventilation, and Prognostic Nutritional Index (PNI). The model showed a good discrimination with an AUC of 0.919 (95% CI: 0.885- 0.953) in the training set, and adjusted to 0.911 (95% CI: 0.878- 0.944) and 0.871 (95% CI: 0.802- 0.940) in the internal validation and the testing set, respectively. ROC curves, calibration curves, DCA curves, C-statistic, Brier score and Hosmer-Lemeshow goodness-of-fit test showed excellent model performance. This study successfully established and validated the first POD prediction model for patients with esophageal cancer resection. It could accurately predict the occurrence of POD and effectively identify the high-risk patients, which is of great significance for improving the risk stratification of the population and for implementing targeted prevention intervention measures.
Keywords: Delirium; Esophageal cancer; Machine learning; POD; Prediction model.
© 2025. The Author(s).
Conflict of interest statement
Declarations. Competing interests: The authors declare no competing interests. Ethics approval and consent to participate: The study was conducted in strict accordance with the ethical standards set out in the 1964 Declaration of Helsinki in terms of moral standards and approved by the Medical Ethics Committee of Jiangnan University, China. The reference number is JNU20221201IRB11. The need for obtaining informed consent has been waived by the Medical Ethics Committee of Jiangnan University due to the retrospective nature of this study. Consent for publication: All authors have agreed to publish in the journal.
Figures
Similar articles
-
A nomogram model to predict postoperative delirium in esophageal cancer patients undergoing esophagectomy.BMC Cancer. 2025 Jul 1;25(1):1082. doi: 10.1186/s12885-025-14478-1. BMC Cancer. 2025. PMID: 40597926 Free PMC article.
-
Comparison of Two Modern Survival Prediction Tools, SORG-MLA and METSSS, in Patients With Symptomatic Long-bone Metastases Who Underwent Local Treatment With Surgery Followed by Radiotherapy and With Radiotherapy Alone.Clin Orthop Relat Res. 2024 Dec 1;482(12):2193-2208. doi: 10.1097/CORR.0000000000003185. Epub 2024 Jul 23. Clin Orthop Relat Res. 2024. PMID: 39051924
-
Development and validation of a nomogram model for predicting the occurrence of necrotizing enterocolitis in premature infants with late-onset sepsis.Eur J Med Res. 2025 Jul 8;30(1):595. doi: 10.1186/s40001-025-02857-0. Eur J Med Res. 2025. PMID: 40629472 Free PMC article.
-
A novel nomogram for predicting osteoporosis with low back pain among the patients in Wenshan Zhuang and Miao Autonomous Prefecture of China.Front Endocrinol (Lausanne). 2025 Jun 5;16:1535163. doi: 10.3389/fendo.2025.1535163. eCollection 2025. Front Endocrinol (Lausanne). 2025. PMID: 40538801 Free PMC article.
-
Development and validation of a nomogram model for predicting postoperative delirium in elderly patients with oral cancer: a retrospective study.BMC Oral Health. 2025 Jul 2;25(1):990. doi: 10.1186/s12903-025-06167-z. BMC Oral Health. 2025. PMID: 40604666 Free PMC article.
References
-
- Dogan, A. D. & Turker, P. F. Nutritional support in older patients with esophageal Cancer undergoing chemoradiotherapy. Nutr. Cancer. 74 (10), 3634–3639 (2022). - PubMed
-
- Fumagalli Romario, U. & de Pascale, S. Esophagectomy-prevention of complications-tips and tricks for the preoperative, intraoperative and postoperative stage. Updates Surg.75 (2), 343–355 (2023). - PubMed
-
- Grover, S. et al. Comparison of symptoms of delirium across various motoric subtypes. Psychiatry Clin. Neurosci.68 (4), 283–291 (2014). - PubMed
-
- Kappenschneider, T. et al. Delirium-an interdisciplinary challenge. Orthopade. 51 (2), 106–115 (2022). - PubMed
Publication types
MeSH terms
Grants and funding
- 2025THQD018/the Scientific Initiation Program funded by Wuxi Taihu University
- 2025THQD018/the Scientific Initiation Program funded by Wuxi Taihu University
- YLA2024017/the Geriatric Care Projec funded by Civil Administration of Jiangsu Province
- YLA2024017/the Geriatric Care Projec funded by Civil Administration of Jiangsu Province
LinkOut - more resources
Full Text Sources
Medical
