. 2025 Sep;17(9):2215-2232.
doi: 10.1038/s44321-025-00277-5. Epub 2025 Jul 21.

PV-1: a novel molecular prognostic marker of distant metastases in various solid tumors

Affiliations

PV-1: a novel molecular prognostic marker of distant metastases in various solid tumors

Chiara Pozzi et al. EMBO Mol Med. 2025 Sep.

Abstract

Identification of biomarkers for the hematogenous spreading of cancer cells is of paramount prognostic and therapeutic value. We showed that Plasmalemma Vesicle Associated Protein-1 (PV-1) serves as a marker of increased blood vessel permeability and is an independent predictor of colorectal cancer dissemination. This study investigates whether PV-1 can also act as a prognostic marker for distant metastases in other solid tumors. We analyzed samples from 134 patients: 30 luminal breast cancer (BC), 52 clear cell renal cell carcinoma (ccRCC), and obtained preliminary data from 52 soft tissue sarcomas (STS). A higher frequency of PV-1+ endothelial cells was significantly associated with metastatic progression in luminal BC and ccRCC. Moreover, the frequency of PV-1+ cells emerged as a significant prognostic factor for metastasis-free survival in both luminal BC and ccRCC. Further research is needed to validate PV-1's prognostic utility, as including it at diagnosis may change the management of these patients and should allow stratification for more aggressive therapies or for closer follow-ups to promptly intervene in case of metastases development.

Keywords: Biomarker; Endothelial Permeability; Metastasis-free Survival; PV-1 (PLVAP); Solid Tumors.


Conflict of interest statement

Disclosure and competing interests statement. Maria Rescigno is an EMM editorial board member, EMBO Member and EMBO Council Chair. This has no bearing on the editorial consideration of this article for publication. The remaining authors declare no competing interests.

Figures

Figure 1
Figure 1. PV-1+ cell frequency in the primary tumor of metastatic and non-metastatic luminal breast cancer patients.
(A) Representative images of PV-1 and CD31 staining on FFPE specimens from luminal breast cancer patients with/without metastases. Scale bars, 100 μm. (B) Percentage of PV-1+ cells among CD31+ cells in the primary tumor of metastatic (n = 18) and non-metastatic (n = 12) luminal breast cancer patients. Data are represented using box-and-whisker plots. Boxplots display values of minimum, first quartile, median, third quartile, and maximum. Each data point represents one sample. Statistical significance was evaluated using the two-sided Mann–Whitney unpaired test. Source data are available online for this figure.
Figure 2
Figure 2. PV-1+ cell frequency in the primary tumor of metastatic and non-metastatic ccRCC patients.
(A) Representative images of PV-1 and CD31 staining on FFPE specimens from ccRCC patients with/without metastases. Scale bars, 100 μm. (B) Percentage of PV-1+ cells among CD31+ cells in the primary tumor of metastatic (n = 22) and non-metastatic (n = 30) ccRCC patients. Data are represented using box-and-whisker plots. Boxplots display values of minimum, first quartile, median, third quartile, and maximum. Each data point represents one sample. Statistical significance was evaluated using the two-sided Mann–Whitney unpaired test. Source data are available online for this figure.
Figure EV1
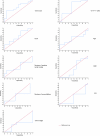
Figure EV1. Time dependent ROC curves for luminal breast cancer at 5 years.
Plots of the time-dependent ROC analysis at 5 years performed for each of the clinical variables analyzed: tumor size, percentage of PV-1+ cells among CD31+ cells, Ki-67, age, number of positive lymph nodes, PgR, number of comorbidities, ER and tumor stage. n = 30 (metastatic, n = 18; non-metastatic, n = 12).
Figure EV2
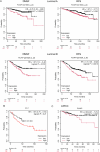
Figure EV2. Kaplan–Meier survival analysis of PV-1 expression levels using the KM plotter tool.
(A) Distant-metastasis-free survival (DMSF) and relapse-free survival (RFS) were analyzed using mRNA gene chip data from Luminal A (DMSF, n = 313; RFS, n = 481) and Luminal B (DMSF, n = 200; RFS, n = 321) breast cancer patients treated with endocrine therapy. (B) Overall survival (OS) analysis based on PV-1 protein expression in breast cancer tissue (n = 65), including Luminal A, Luminal B, HER2-positive, and triple-negative breast cancer (TNBC) subtypes. (C) Relapse-free survival (RFS) was analyzed using mRNA-seq data from ccRCC patients (n = 117).
Figure EV3
Figure EV3. ROC curve analysis of PV-1 expression in luminal breast cancer subtypes using ROC Plotter.
ROC Plotter constructs the ROC curve using 5-year relapse-free survival (RFS) as the clinical endpoint. Patients are classified based on clinical outcome: those without relapse within 5 years, and those with relapse within 5 years. PV-1 gene expression is evaluated as a continuous predictor of outcome. The analysis was performed separately for luminal A (n = 637; AUC = 0.533) and luminal B (n = 253; AUC = 0.608) breast cancer patients treated with endocrine therapy.
Figure EV4
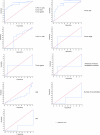
Figure EV4. Time-dependent ROC curves for ccRCC at 5 years.
Plots of the time-dependent ROC analysis at 5 years performed for each of the clinical variables analyzed (tumor size, percentage of PV-1+ cells among CD31+ cells, tumor stage, tumor grade, presence of venous neoplastic thrombosis, age, number of comorbidities and sex) and for the combination of tumor size, tumor grade, and percentage of PV-1+ cells. n = 52 (metastatic, n = 22; non-metastatic, n = 30).
Figure EV5
Figure EV5. PV-1+ cell frequency in the primary tumor of metastatic and non-metastatic sarcoma patients from the LMS, MPNST, SFT, and UPS histotypes.
(A) Percentage of PV-1+ cells among CD31+ cells in the primary tumor of metastatic (n = 17) and non-metastatic (n = 10) sarcoma patients. Data are represented using box and whisker plots. Boxplots display values of minimum, first quartile, median, third quartile, and maximum. Each data point represents one sample. Statistical significance was evaluated using the two-sided Mann–Whitney unpaired test. (B) Metastasis-free survival of sarcoma patients depending on the PV-1 group (high vs. low). PV-1high group: % PV-1+/CD31+ cells ≥20; PV-1low: % PV-1+/CD31+ cells <20. n = 27 (metastatic, n = 17; non-metastatic, n = 10). (C) Plot of the time-dependent ROC analysis at 5 years performed for the combination of PV-1 group and tumor size (score). n = 27 (metastatic, n = 17; non-metastatic, n = 10).

References

    1. Abara E, Chivulescu I, Clerk N, Cano P, Goth A (2010) Recurrent renal cell cancer: 10 years or more after nephrectomy. Can Urol Assoc J 4:E45–49 - PMC - PubMed
    1. Bertocchi A, Carloni S, Ravenda PS, Bertalot G, Spadoni I, Lo Cascio A, Gandini S, Lizier M, Braga D, Asnicar F et al (2021) Gut vascular barrier impairment leads to intestinal bacteria dissemination and colorectal cancer metastasis to liver. Cancer Cell 39:708–724.e711 - PubMed
    1. Capitanio U, Montorsi F (2016) Renal cancer. Lancet 387:894–906 - PubMed
    1. Cardoso F, Costa A, Senkus E, Aapro M, André F, Barrios CH, Bergh J, Bhattacharyya G, Biganzoli L, Cardoso MJ et al (2017) 3rd ESO-ESMO International Consensus Guidelines for Advanced Breast Cancer (ABC 3). Ann Oncol 28:16–33 - PMC - PubMed
    1. Cossetti RJ, Tyldesley SK, Speers CH, Zheng Y, Gelmon KA (2015) Comparison of breast cancer recurrence and outcome patterns between patients treated from 1986 to 1992 and from 2004 to 2008. J Clin Oncol 33:65–73 - PubMed