. 2025 Aug;7(8):1570-1592.
doi: 10.1038/s42255-025-01333-7. Epub 2025 Jul 21.

LONP1 regulation of mitochondrial protein folding provides insight into beta cell failure in type 2 diabetes

Affiliations

LONP1 regulation of mitochondrial protein folding provides insight into beta cell failure in type 2 diabetes

Jin Li et al. Nat Metab. 2025 Aug.

Abstract

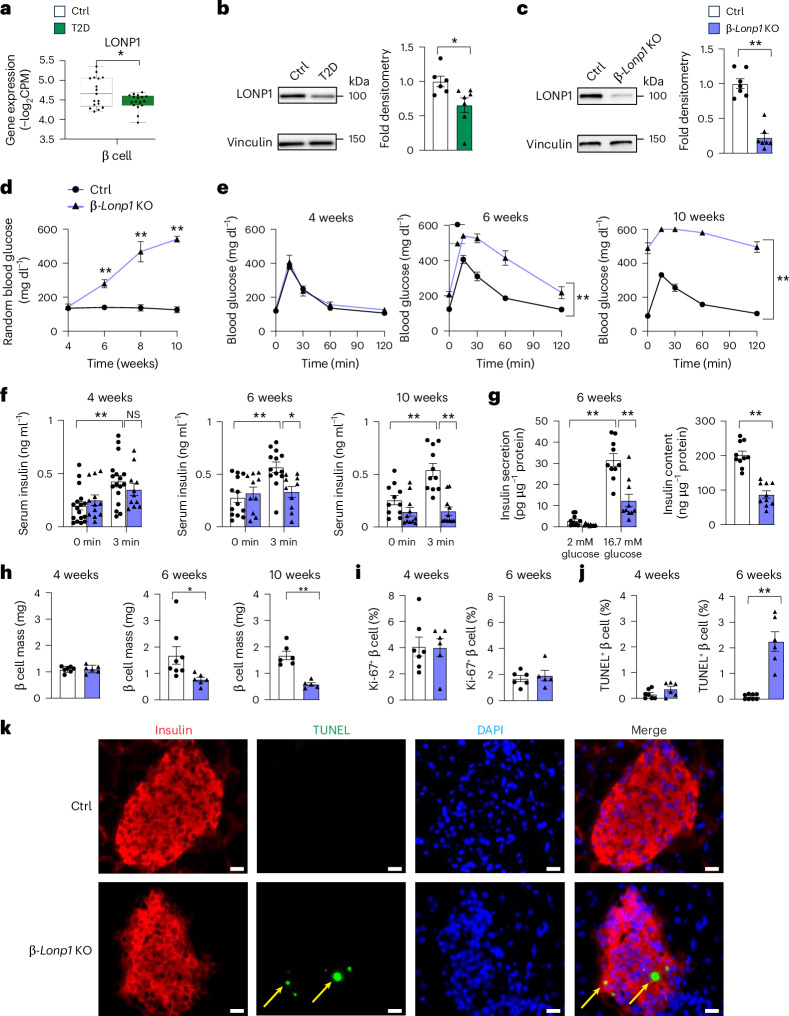
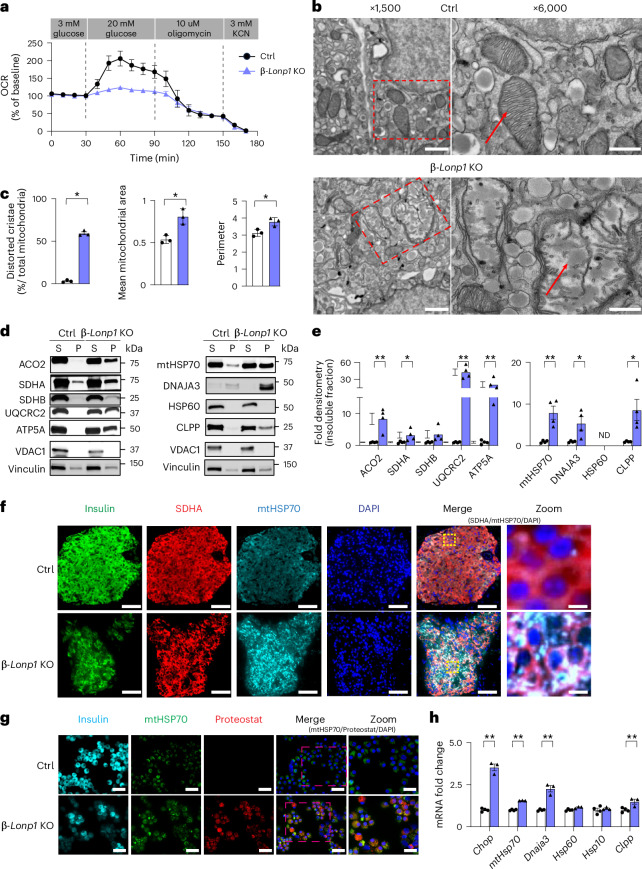
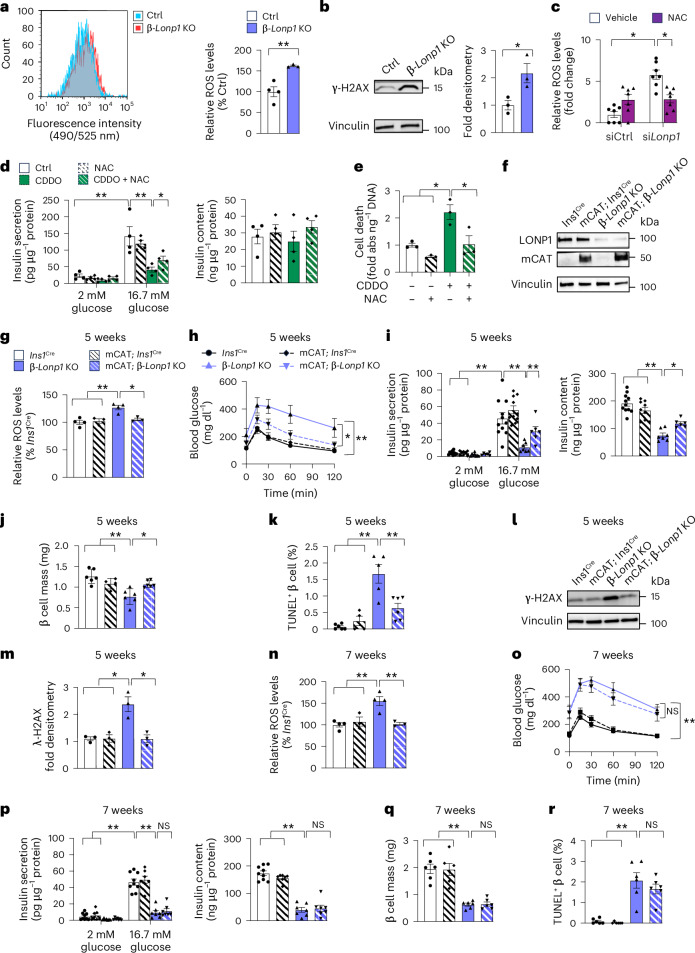
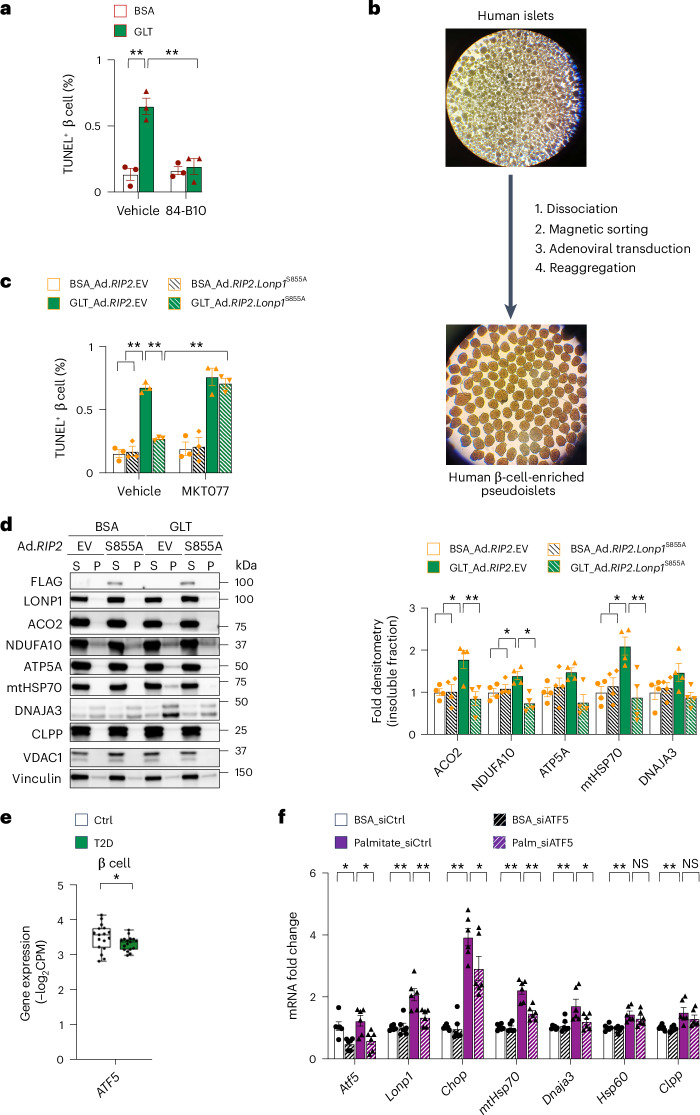
Protein misfolding is a contributor to the development of type 2 diabetes (T2D), but the specific role of impaired proteostasis is unclear. Here we show a robust accumulation of misfolded proteins in the mitochondria of human pancreatic islets from patients with T2D and elucidate its impact on β cell viability through the mitochondrial matrix protease LONP1. Quantitative proteomics studies of protein aggregates reveal that islets from donors with T2D have a signature resembling mitochondrial rather than endoplasmic reticulum protein misfolding. Loss of LONP1, a vital component of the mitochondrial proteostatic machinery, with reduced expression in the β cells of donors with T2D, yields mitochondrial protein misfolding and reduced respiratory function, leading to β cell apoptosis and hyperglycaemia. LONP1 gain of function ameliorates mitochondrial protein misfolding and restores human β cell survival after glucolipotoxicity via a protease-independent effect requiring LONP1-mitochondrial HSP70 chaperone activity. Thus, LONP1 promotes β cell survival and prevents hyperglycaemia by facilitating mitochondrial protein folding. These observations provide insights into the nature of proteotoxicity that promotes β cell loss during the pathogenesis of T2D, which could be considered as future therapeutic targets.


Conflict of interest statement

Competing interests: S.A.S. has received grant funding from Ono Pharmaceutical and is a consultant for Novo Nordisk. G.A.R. has received grant funding from Sun Pharmaceuticals and Les Laboratoires Servier and is a consultant for Sun Pharmaceuticals. A.I.N. receives royalties from the University of Michigan for the sale of MSFragger and IonQuant software licences to commercial entities. All licence transactions are managed by the University of Michigan Innovation Partnerships office; all proceeds are subject to university technology transfer policy. The other authors declare no competing interests.

Figures

Fig. 1
Fig. 1. Insoluble mitochondrial proteins are enriched in human islets from donors with T2D.
a, Schematic diagram illustrating the Triton X-100 approach to quantitatively examine protein solubility. b, Volcano plot of differentially expressed insoluble proteins from donors with T2D compared to Ctrls without T2D determined using −log10(P > 1.3) and log2 fold change greater than 0.1. Mitochondrial proteins (curated from MitoCarta3.0) are highlighted in green. n = 4 independent islet donors per group. c, GO cellular component analysis of significantly upregulated insoluble proteins in T2D islets. n = 4 independent islet donors per group. d, Volcano plot of differentially expressed soluble proteins in T2D islets. n = 4 independent islet donors per group. e, GO cellular component analysis of significantly downregulated soluble proteins in T2D islets. n = 4 independent islet donors per group. f, Representative immunoblot images of selected mitochondrial proteins of human islets. g, Quantification of mitochondrial insoluble proteins as fold densitometry of the insoluble/soluble protein ratio. n = 4 independent human islet donors per group. VDAC1 serves as a soluble mitochondrial protein loading control. Vinculin serves as a loading control for both soluble and insoluble fractions. h, Representative deconvolution immunofluorescence image (n = 5 for Ctrl and n = 3 for T2D) depicting mtHSP70 expression and localization from pancreatic sections of human islet donors. i,j, Volcano plots for differentially expressed proteins in the insoluble (i) and soluble (j) fractions of non-diabetic islets exposed to 1 μM CDDO or vehicle for 24 h. n = 4 independent islet donors per group. k,l, Volcano plots for differentially expressed proteins in the insoluble (k) and soluble (l) fractions of non-diabetic islets exposed to 1 μg ml−1 TUN or vehicle for 24 h. n = 4 independent islet donors per group. m, UpSet blot visualizing the intersections in insoluble protein enrichment among the T2D, CDDO and TUN groups. All data are presented as the mean ± s.e.m. b,d,il, P < 0.05 was determined using a two-tailed limma moderated t-test. c, P < 0.05 was determined using a hypergeometric test followed by multiple hypotheses testing using false discovery rate (FDR)-corrected P values (FDR < 0.05). g, *P < 0.05, **P < 0.01 was determined using an unpaired, two-tailed Student’s t-test. h, Scale bar, 6.25 μm. DEG, differentially expressed gene; ESCRT, endosomal sorting complexes required for transport; MS3, three-stage mass spectrometry; ND, not determined; P, insoluble fraction; S, soluble fraction. Source data
Fig. 2
Fig. 2. Pancreatic β-cell-specific LONP1 deficiency leads to hyperglycaemia due to β cell apoptosis and loss of β cell mass.
a, Pseudobulk gene expression data of LONP1 from the β cells of human islet donors with or without T2D using scRNA-seq. n = 17 donors without T2D, n = 17 donors with T2D. The box plots present the minimum, first quartile, median, third quartile, maximum and interquartile range. b, Expression of LONP1 using immunoblotting (left) and protein densitometry (right) in human islets from donors with T2D and Ctrl donors without T2D. n = 6 donors without T2D, n = 7 donors with T2D. c, Expression of LONP1 using immunoblotting (left) and protein densitometry (right) in islets isolated from 4–6-week-old Ctrl and β-Lonp1KO mice. n = 7 mice per group. d, Random blood glucose concentrations from Ctrl and β-Lonp1 KO mice measured between the ages of 4 and 10 weeks. n = 16 Ctrl versus 12 β-Lonp1 KO at 4 weeks; n = 15 Ctrl versus 12 β-Lonp1 KO at 6 weeks; n = 6 Ctrl versus 5 β-Lonp1 KO at 8 weeks; n = 6 Ctrl versus 5 β-Lonp1 KO at 10 weeks. e, Blood glucose concentrations measured during IPGTT from Ctrl and β-Lonp1 littermates at ages 4, 6 and 10 weeks. n = 10 Ctrl versus 8 β-Lonp1 KO at 4 weeks; n = 14 Ctrl versus 11 β-Lonp1 KO at 6 weeks; n = 6 Ctrl versus 5 β-Lonp1 KO at 10 weeks. f, Serum insulin concentrations measured after in vivo glucose stimulation from Ctrl and β-Lonp1 KO mice at ages 4, 6 and 10 weeks. n = 17 Ctrl versus 11 β-Lonp1 at 4 weeks; n = 13 Ctrl versus 10 β-Lonp1 KO at 6 weeks; n = 11 Ctrl versus 11 β-Lonp1 KO at 10 weeks. g, GSIS after static incubation in 2 mM and 16.7 mM glucose (left) and islet insulin content (right), performed in isolated islets of 6-week-old Ctrl and β-Lonp1 KO littermates. n = 10 per group. h, Pancreatic β cell mass measured in Ctrl and β-Lonp1 littermates at ages 4, 6 and 10 weeks. n = 7 Ctrl versus 6 β-Lonp1 KO at 4 weeks; n = 8 Ctrl versus 6 β-Lonp1 KO at 6 weeks; n = 6 Ctrl versus 5 β-Lonp1 KO at 10 weeks. i, Quantification of β cell replication by Ki-67 and insulin immunostaining from pancreatic sections of 4-week-old and 6-week-old Ctrl and β-Lonp1 KO littermates. n = 7 Ctrl versus 6 β-Lonp1 KO at 4 weeks; n = 6 Ctrl versus 5 β-Lonp1 at 6 weeks. j, Quantification of β cell death using TUNEL and insulin immunostaining from pancreatic sections of 4-week-old and 6-week-old Ctrl and β-Lonp1 KO littermates. n = 7 Ctrl versus 6 β-Lonp1 KO at 4 weeks; n = 8 Ctrl versus 6 β-Lonp1 KO at 6 weeks. k, Representative immunofluorescence image from pancreatic sections of 6-week-old Ctrl and β-Lonp1 KO littermates for TUNEL staining. The yellow arrows indicate insulin+TUNEL+ cells. All data are presented as the mean ± s.e.m. a, *P < 0.05 was determined using both an unpaired, two-tailed Student’s t-test and FDR < 5% for multiple testing correction. b,c,hj, *P < 0.05 and **P < 0.01 were determined using an unpaired, two-tailed Student’s t-test. dg, *P < 0.05 and **P < 0.01 were determined using a one-way analysis of variance (ANOVA) followed by a Tukey’s multiple comparisons test. k, Scale bar, 50 μm. DAPI, 4′,6-diamidino-2-phenylindole; NS, not significant. Source data
Fig. 3
Fig. 3. Deficiency of LONP1 results in impaired mitochondrial respiration, accumulation of misfolded mitochondrial proteins and activation of the UPRmt in β cells.
a, Oxygen consumption rate (OCR) measured after exposure to 3 mM glucose, 20 mM glucose, 10 μM oligomycin and 3 mM KCN in isolated islets from 6-week-old littermate Ctrl and β-Lonp1 KO mice. n = 3 mice per group. b, Representative TEM images from the β cells of 6-week-old Ctrl and β-Lonp1 KO mice. The red rectangle with the dashed outline on the left highlights the focused area of mitochondria on the right. The red arrow denotes mitochondria. n = 3 mice per group. c, Quantification of TEM images of mitochondria (~100 independent mitochondria scored per animal) with distorted cristae, mitochondrial area and mitochondrial perimeter in the β cells of 6-week-old Ctrl and β-Lonp1 KO mice. n = 3 per group. d,e, Representative immunoblotting images (d) and quantification of mitochondrial insoluble proteins (normalized to vinculin) (e) from 6-week-old Ctrl and β-Lonp1 KO mice. VDAC1 serves as a soluble mitochondrial protein loading control. Vinculin serves as a loading control for both soluble and insoluble fractions. n = 4 per group. f, Representative immunofluorescence image (n = 4 per group) depicting mtHSP70 expression and localization from pancreatic sections of 6-week-old Ctrl mice and β-Lonp1 littermates. The yellow boxes in the merged image are visualized at higher magnification (zoom, far right). g, Representative immunofluorescence image (n = 3 per group) depicting Proteostat visualization of protein aggregates and colocalization with mtHSP70 in the islets of 6-week-old Ctrl mice and β-Lonp1 KO littermates. The pink dashed boxes in the merged image denote regions visualized at higher magnification (zoom, far right). h, Quantitative PCR with reverse transcription (RT–qPCR) of markers of the UPRmt from RNA isolated from 6-week-old Ctrl and β-Lonp1 KO islets. n = 4 Ctrl versus 3 β-Lonp1 KO. All data are presented as the mean ± s.e.m. c,e,h, *P < 0.05 and **P < 0.01 were determined using an unpaired, two-tailed Student’s t-test. b, Scale bar (left), 2 μm; scale bar (right), 500 nm. f, Scale bar (insulin, SDHA, mtHSP70, DAPI, merge), 50 μm; scale bar (zoomed image), 6.25 μm. g, Scale bar (insulin, mtHSP70, Proteostat, merge), 12.5 μm; scale bar (zoomed image), 8.5 μm. Source data
Fig. 4
Fig. 4. Genetic or pharmacological free radical scavengers provide transiently improved cell survival after LONP1 deficiency in mouse and human islets.
a, Representative flow cytometry histogram demonstrating cellular ROS (left) and quantification of relative ROS levels (right) in dispersed islets isolated from 6-week-old mice. n = 4 Ctrl versus 3 β-Lonp1 KO. b, Representative immunoblot images (left) and densitometry (right) of phospho-γH2AX in islets isolated from 6-week-old mice. n = 3 mice per group. c, Quantification of relative ROS levels in Min6 β cells 72 h after transfection with siLonp1 or siCtrl and treated with 5 mM NAC or vehicle Ctrl for the final 36 h. n = 7 per group. d, GSIS (left) after static incubation in 2 mM and 16.7 mM glucose, and islet insulin content (right), measured in human islets treated with or without 1 µM CDDO and with or without 5 µM NAC for 24 h. n = 4 independent islet donors per group. e, Quantification of cell death measured in human islets treated with or without 1 µM CDDO and with or without 5 mM NAC for 24 h. n = 4 independent islet donors per group. f, Expression of catalase and LONP1 using immunoblotting in islets isolated from 5–7-week-old mice. Representative of three mice per group. g, Quantification of relative ROS levels determined using flow cytometry in the isolated islets of 5-week-old mice. n = 3 mice per group. h, Blood glucose concentrations measured during IPGTT from 5-week-old Ins1Cre (n = 15), mCAT; Ins1Cre (n = 6), β-Lonp1 KO (n = 8) and mCAT; β-Lonp1 KO mice (n = 13). i, GSIS (left) after static incubation in 2 mM and 16.7 mM glucose, and islet insulin content (right) measured in isolated islets of 5-week-old Ins1Cre (n = 11), mCAT; Ins1Cre (n = 10), β-Lonp1 KO (n = 7) and mCAT; β-Lonp1 KO (n = 6) mice. j, Pancreatic β cell mass measured in 5-week-old Ins1Cre (n = 6), mCAT; Ins1Cre (n = 4), β-Lonp1 KO (n = 6) and mCAT; β-Lonp1 KO (n = 6) mice. k, Quantification of β cell death using TUNEL and insulin immunostaining from pancreatic sections of 5-week-old Ins1Cre (n = 6), mCAT; Ins1Cre (n = 4), β-Lonp1 KO (n = 5) and mCAT; β-Lonp1 KO (n = 6). l, Expression of phospho-γH2AX using immunoblotting. m, Phospho-γH2AX densitometry in islets isolated from 5-week-old mice. n = 3 mice per group. n, Quantification of relative ROS production in the islets of 7-week-old mice. n = 3 mice per group. o, Blood glucose levels measured during IPGTT from 7-week-old Ins1Cre (n = 11), mCAT; Ins1Cre (n = 4), β-Lonp1 KO (n = 7) and mCAT; β-Lonp1 KO (n = 9) mice. p, GSIS (left) after static incubation in 2 mM and 16.7 mM glucose, and islet insulin content (right) measured in the isolated islets of 7-week-old Ins1Cre (n = 9), mCAT; Ins1Cre (n = 7), β-Lonp1 KO (n = 7) and mCAT; β-Lonp1 KO (n = 7) mice. q, β cell mass determined in pancreatic sections of 7-week-old mice. n = 6 mice per group. r, Quantification of TUNEL staining performed in pancreatic sections of 7-week-old mice for β cell apoptosis. n = 6 mice per group. All data are presented as the mean ± s.e.m. a,b, *P < 0.05 and **P < 0.01 were determined using an unpaired, two-tailed Student’s t-test. ce,gk,mr, *P < 0.05 and **P < 0.01 were determined using a one-way ANOVA followed by Tukey’s multiple comparisons test. Source data
Fig. 5
Fig. 5. Mitochondrial protein misfolding is not ameliorated by antioxidants and precedes the appearance of oxidative stress after LONP1 deficiency.
a, Representative immunoblotting images of selected mitochondrial proteins. b, Quantification of mitochondrial insoluble proteins (normalized to vinculin) using the densitometry of human islets exposed to dimethyl sulfoxide (DMSO) (Ctrl), 1 μM CDDO or 1 μM CDDO + 5 mM NAC for 24 h. VDAC1 serves as a soluble mitochondrial protein loading control. Vinculin serves as a loading control for both soluble and insoluble fractions. n = 4 independent human islet donors per group. c, Representative immunoblot images of ETC–OXPHOS system proteins (top) and quantification of mitochondrial insoluble proteins (normalized to vinculin) using densitometry (bottom) in the isolated islets of mice at both 5 and 7 weeks of age. n = 3 biological replicates per group. d, Representative immunoblot images of mitochondrial matrix chaperones and proteases (top) and quantification of fractions of mitochondrial insoluble proteins (normalized to vinculin) using densitometry (bottom) of isolated islets of mice at both 5 and 7 weeks of age. n = 3 biological replicates per group. e, Representative immunoblot images of ETC–OXPHOS system proteins (left) and quantification of mitochondrial insoluble proteins (normalized to vinculin) using densitometry (right) of the isolated islets of 4-week-old mice. n = 3 independent mice per group. f, Representative immunoblot images of mitochondrial chaperones and proteases (left) and quantification of mitochondrial insoluble proteins (normalized to vinculin) using densitometry (right) of the isolated islets of 4-week-old mice. n = 3 independent mice per group. g, Quantification of relative ROS production in the islets of 4-week-old mice. n = 3 mice per group. h, BN-PAGE followed by immunoblotting for OXPHOS complexes performed in the isolated islets from 4-week-old mice. The quantification of complexes I, III, IV and V (normalized to complex II) using densitometry from BN-PAGE studies is shown in the graph on the right. n = 4 per group. All data are presented as the mean ± s.e.m. bd, *P < 0.05 and **P < 0.01 were determined using a one-way ANOVA followed by Tukey’s multiple comparisons test. e,f,h, *P < 0.05 and **P < 0.01 were determined using an unpaired, two-tailed Student’s t-test. Source data
Fig. 6
Fig. 6. LONP1-mtHSP70 chaperone activity promotes β cell survival by relieving mitochondrial protein misfolding.
a, Schematic diagram illustrating the generation of mouse pseudoislets. b, TUNEL staining for β cell apoptosis performed in mouse pseudoislets dissociated for cytocentrifugation from 5-week-old Ctrl mice and β-Lonp1 KO littermates performed 7 days after adenoviral transduction with RIP2-driven EV (Ad.RIP2.EV) and the protease-deficient Lonp1S855A mutant (Ad.RIP2.Lonp1S855A), with exposure to vehicle (DMSO) or 1 μM of the mtHSP70 inhibitor MKT077 for the final 24 h. Representative images of 3–4 mice per group. The yellow arrows indicate insulin+TUNEL+ cells. c, Quantification of TUNEL staining from the studies in b. n = 4 vehicle versus three MKT077 biological replicates. d, Expression of mitochondrial proteins from the soluble and insoluble fractions performed in mouse pseudoislets from 5-week-old Ctrl and β-Lonp1 KO mice 7 days after adenoviral transduction with Ad.RIP2.EV or Ad.RIP2.Lonp1S855A using immunoblotting. Representative images of three mice per group. VDAC1 serves as a soluble mitochondrial protein loading control. Vinculin serves as a loading control for both soluble and insoluble fractions. e, Quantification of mitochondrial insoluble proteins (normalized to vinculin) from the studies in d. n = 3 biological replicates per group. f, Expression of mitochondrial proteins from soluble and insoluble fractions of mouse pseudoislets generated from 8-week-old Lonp1loxP/loxP; MIP1-CreERT mice 7 days after adenoviral transduction with Ad.RIP2.EV or Ad.RIP2.Lonp1S855A. Pseudoislets were co-cultured with vehicle (EtOH) or 2 μM 4-hydroxytamoxifen (4-OHT) to induce recombination in vitro and generate experimental groups (Ctrl or iβ-Lonp1 KO, respectively) before the generation of soluble or insoluble fractions for immunoblotting. Representative images of three biological replicates per group. g, Quantification of mitochondrial insoluble proteins (normalized to vinculin) from the studies in f. n = 3 biological replicates per group. All data are presented as the mean ± s.e.m. c,e,g, *P < 0.05 and **P < 0.01 were determined using a one-way ANOVA followed by Tukey’s multiple comparisons test. b, Scale bar, 50 μm. Source data
Fig. 7
Fig. 7. LONP1 promotes human β cell survival and is transcriptionally regulated by ATF5 after GLT.
a, Quantification of TUNEL staining for β cell apoptosis in human islets after exposure to BSA or GLT together with DMSO or 40 μM of the LONP1 activator 84-B10 for 48 h. n = 3 independent human islet donors per group. b, Schematic diagram illustrating the generation of human β-cell-enriched pseudoislets. c, Quantification of TUNEL staining for β cell apoptosis in human β-cell-enriched pseudoislets 7 days after adenoviral transduction with RIP2-driven EV (Ad.RIP2.EV) or the protease-deficient Lonp1S855A mutant (Ad.RIP2.Lonp1S855A), followed by exposure to BSA or GLT for the final 48 h, and DMSO or 1 μM MKT077 for the final 24 h. n = 3 independent human islet donors per group. d, Representative immunoblots (left) of mitochondrial proteins from the soluble and insoluble fractions of human β-cell-enriched pseudoislets 8 days after Ad.RIP2.EV or Ad.RIP2.Lonp1S855A transduction, exposed to BSA or GLT for the final 72 h. Quantification of mitochondrial insoluble proteins using densitometry (normalized to vinculin) is shown in the graph on the right. VDAC1 serves as a soluble mitochondrial protein loading control. Vinculin serves as a loading control for both soluble and insoluble fractions. n = 4 independent islet donors per group. e, Pseudobulk gene expression of ATF5 from the β cells of human islet donors with or without T2D using scRNA-seq. The box plots present the minimum, first quartile, median, third quartile, maximum and interquartile range. n = 17 donors without T2D, n = 17 donors with T2D. f, RT–qPCR of Atf5 and markers of the UPRmt from RNA isolated from Min6 β cells 72 h after transfection with siATF5 or siCtrl, and exposure to 0.5 mM palmitate or BSA control for the final 48 h. n = 6 per group. All data are presented as the mean ± s.e.m. a,c,d,f, *P < 0.05 and **P < 0.01 were determined using a one-way ANOVA followed by Tukey’s multiple comparisons test. e, *P < 0.05 was determined using both an unpaired, two-tailed Student’s t-test and FDR < 5% for multiple testing correction. Source data
Extended Data Fig. 1
Extended Data Fig. 1. Pathway analyses of quantitative proteomics of soluble and insoluble fractions from human islet donors with or without T2D.
(a) GO biological process (left) and molecular function (right) analysis of significantly upregulated insoluble proteins from human islet donors with T2D compared to non-diabetic controls. n = 4 independent islet donors/group. (b) GO biological process (left) and molecular function (right) analysis of significantly downregulated insoluble proteins from human islet donors with T2D compared to non-diabetic controls. n = 4 independent islet donors/group. (c) GO cellular component (left) and biological process (right) analysis of significantly upregulated soluble proteins from human islet donors with T2D compared to non-diabetic controls. n = 4 independent islet donors/group. (d) GO molecular function analysis of significantly upregulated soluble proteins from human islet donors with T2D compared to non-diabetic controls. n = 4 independent islet donors/group. (e) Venn diagram displaying the overlap between differentially enriched mitochondrial proteins from the insoluble fraction of human islets from donors with T2D and experimentally validated mitochondrial long-lived proteins. (f) Quantification of protein expression of insoluble fraction (left) and soluble fraction (right) by densitometry from studies in Fig. 1f as fold change compared to control of insoluble and soluble protein expression normalized to VINCULIN. n = 4 independent human islet donors/group. *P < 0.05 by unpaired two-tailed Student’s t-test. (g) LONP1 protein densitometry (normalized to VINCULIN) in human islets only from donors with T2D and non-diabetic control donors used for TMT-MS studies. n = 4 independent human islet donors/group. Data are presented as mean ± SEM. Statistical analysis: 1A-D *P < 0.05 by hypergeometric test followed by multiple hypothesis testing using false discovery rate (FDR)-corrected P values (FDR < 0.05). Source data
Extended Data Fig. 2
Extended Data Fig. 2. MitoPathways assessment of soluble and insoluble proteins from islet donors with T2D.
(a) Differential expression heatmap of significantly upregulated mitochondrial proteins in the insoluble fraction of T2D islets compared to non-diabetic controls. n = 4 independent islet donors/group. Proteins are categorized based on annotation from MitoPathways3.0. Black boxes separate different categories of mitochondrial proteins. (b) Differential expression heatmap of significantly downregulated mitochondrial proteins in the soluble fraction of T2D islets compared to non-diabetic controls. Proteins are categorized based on annotation from MitoPathways3.0. Black boxes used to create space to separate different categories of mitochondrial proteins for readability. Source data
Extended Data Fig. 3
Extended Data Fig. 3. Alterations in mitochondrial protein solubility are observed in human islets following pharmacologic induction of mitochondrial rather than ER protein misfolding.
(a) TFAM and LONP1 protein levels visualized by WB (Left) and densitometry (Right) of recombinant purified human TFAM and LONP1 to assess LONP1 protease activity in the presence of 5 μM CDDO or Vehicle (DMSO). LONP1 protein levels serve as a reference/loading control. n = 3 independent experiments/group. (b) Cellular component analysis of significantly upregulated insoluble proteins (left) and cellular component analysis of significantly downregulated soluble proteins (right) from 1 μM CDDO-exposed islets compared to DMSO control islets. n = 4 independent islet donors/group. (c) Cellular component analysis of significantly upregulated insoluble proteins (left) and cellular component analysis of significantly downregulated soluble proteins (right) from 1 μg/mL tunicamycin (TUN)-exposed islets compared to DMSO control islets. n = 4 independent islet donors/group. (d) Representative WB images of selected mitochondrial proteins of human islets and (e) quantification of protein expression by densitometry (normalized to VINCULIN). n = 4 independent islet donors/group. VDAC1 serves as a soluble mitochondrial protein loading control. VINCULIN serves as a loading control for both soluble and insoluble fractions. S, soluble fraction; P, insoluble fraction. (f) Representative immunofluorescence image (n = 4/group) depicting Proteostat visualization of protein aggregates and co-localization with mtHSP70 in islets of 8-week-old C57BL/6N mice exposed to 1 μM CDDO or DMSO control for 20 h. Scale bars (Insulin, mtHSP70, Proteostat, Merge), 12.5 μm; Scale bar (zoom), 8.5 μm. Pink dashed boxes within merged image denote regions visualized at higher magnification (Zoom - far right). (g) Quantitative RT-PCR of markers of the mitochondrial unfolded protein response (UPRmt) from RNA isolated from islets of 12-week-old C57BL/6N mice exposed to 1 μM CDDO or DMSO control for 24 h. n = 3 mice/group. All data in figure are presented as mean ± SEM. Statistical analysis: 3A and 3E, *P < 0.05 by one-way ANOVA followed by Tukey’s multiple comparisons test; 3B and 3C *P < 0.05 by hypergeometric test followed by multiple hypothesis testing using FDR-corrected P values (FDR < 0.05); 3G, *P < 0.05, **P < 0.01 by unpaired two-tailed Student’s t-test. Source data
Extended Data Fig. 4
Extended Data Fig. 4. Expression of mitochondrial proteases and chaperones is not altered in β cells and α cells of human islet donors with T2D.
Pseudobulk gene expression data, presented as log2CPM, of mitochondrial matrix proteases (a) and chaperones (b) from β cells and α-cells of human islet donors with or without T2D by single cell RNA sequencing. Box plots are presented the minimum, first quartile, median, third quartile, maximum, and interquartile range. *P < 0.05 by both unpaired two-tailed Student’s t-test and FDR < 5% for multiple testing correction. n = 17 non-diabetic donors, n = 17 donors with T2D. Source data
Extended Data Fig. 5
Extended Data Fig. 5. LONP1 deficiency leads to reduced β cell mass due to increases in β cell apoptosis rather than alterations in β cell maturity/dedifferentiation.
(a) Model of Cre-mediated recombination of the LonP1 locus. (b) Ad libitum-fed body weight measured in littermate mice between ages 5–7 weeks. n = 5 Ins1+/+; LonP1loxP/loxP vs 8 Ins1Cre/+; LonP1+/+ at 5 weeks; n = 7 Ins1+/+; LonP1loxP/loxP vs 5 Ins1Cre/+; LonP1+/+ at 7 weeks. (c) Blood glucose concentrations measured during IPGTT in littermate mice at age 5 weeks (left) and age 7 weeks (right). n = 5 Ins1+/+; LonP1loxP/loxP vs 8 Ins1Cre/+; LonP1+/+ at 5 weeks; n = 7 Ins1+/+; LonP1loxP/loxP vs 5 Ins1Cre/+; LonP1+/+ at 7 weeks. (d) Blood glucose concentrations measured during IPGTT related to Fig. 2e. n = 8 male vs 6 female/Ctrl group and 7 male vs 4 female/ β-LonP1KO group. (e) Ad libitum-fed body weight measured in mice between ages 4–10 weeks. n = 10 Ctrl vs 8 β-LonP1KO at 4 weeks; n = 10 Ctrl vs 8 β-LonP1KO at 6 weeks; n = 6 Ctrl vs 5 β-LonP1KO at 10 weeks. (f) Blood glucose concentrations (presented as % of baseline glucose) measured during insulin tolerance testing (ITT) of 4-week-old (left) and 6-week-old (right) mice. n = 5 Ctrl vs 3 β-LonP1KO at 4 weeks; n = 10 Ctrl vs 6 β-LonP1KO at 6 weeks. (g) Glucose-stimulated insulin secretion following static incubations in 2 mM and 16.7 mM glucose, performed in isolated islets of 6-week-old mice (normalized to total insulin content). n = 10 mice/group. (h) Pancreatic β cell mass related to Fig. 2h. n = 3 male vs 4 female/Ctrl group and 4 male vs 2 female/ β-LonP1KO group at 4 weeks; n = 5 male vs 3 female/Ctrl group and 3 male vs 3 female/ β-LonP1KO group at 6 weeks; n = 3 male vs 3 female/Ctrl group and 4 male vs 1 female/ β-LonP1KO group at 10 weeks. (i) Quantification of cell death ELISA (normalized to total DNA content) measured in isolated islets of 6-week-old mice. n = 7 mice/group. (j) Representative immunofluorescence images (n = 5/group) depicting β cell maturity (left) or dedifferentiation markers (right) from pancreatic sections of 6-week-old mice. A representative image of pancreatic sections of high fat diet-fed of β-Clec16aKO mice as a positive control for ALDH1A3 immunostaining. Scale bars, 50 μm. All data in figure are presented as mean ± SEM. Statistical analysis: 5 G, **P < 0.01 by one-way ANOVA followed by Tukey’s multiple comparisons test. 5I, *P < 0.05 by unpaired two-tailed Student’s t-test. Source data
Extended Data Fig. 6
Extended Data Fig. 6. Reductions in β cell mass and glucose tolerance in adult mice following LonP1 deficiency are not due to developmental defects.
(a) Representative WB images and (b) quantification of LONP1 expression with densitometry (normalized to VINCULIN) in islets isolated from 15-week-old mice 7 weeks after Veh or TM administration. n = 4 mice/group. (c) Blood glucose concentrations measured during IPGTT in 15-week-old MIP-CreERT; LonP1loxP/loxP + TM mice (n = 15) as well as both MIP1-CreERT + TM (n = 11) and MIP-CreERT; LonP1loxP/loxP + Veh (n = 13) littermate controls 7 weeks after Veh or TM administration. (d) Serum insulin measured during in vivo glucose-stimulated insulin release testing in 15-week-old MIP-CreERT; LonP1loxP/loxP + TM mice (n = 14) as well as both MIP1-CreERT + TM (n = 11) and MIP-CreERT; LonP1loxP/loxP + Veh (n = 13) littermate controls 7 weeks after Veh or TM administration. (e) β cell mass measured in 15-week-old MIP-CreERT; LonP1loxP/loxP + TM (n = 11) as well as both MIP1-CreERT + TM (n = 8) and MIP-CreERT; LonP1loxP/loxP + Veh (n = 8) littermate controls 7 weeks after Veh or TM administration. n = 8–11 mice/group; (f) Quantification of β cell apoptosis measured as the % of TUNEL+/Insulin+ cells performed in pancreatic sections of 15-week-old MIP-CreERT; LonP1loxP/loxP + TM mice (n = 11) as well as both MIP1-CreERT + TM (n = 8) and MIP-CreERT; LonP1loxP/loxP + Veh (n = 8) littermate controls 7 weeks after Veh or TM administration. (g) Quantification of β cell replication measured as the % of Ki67+/Insulin+ cells performed in pancreatic sections of 15-week-old MIP-CreERT; LonP1loxP/loxP + TM mice as well as both MIP1-CreERT + TM and MIP-CreERT; LonP1loxP/loxP + Veh littermate controls 7 weeks after Veh or TM administration. n = 4 mice/group. All data in figure are presented as mean ± SEM. Statistical analysis: 6B–6F, *P < 0.05, **P < 0.01 by one-way ANOVA followed by Tukey’s multiple comparisons test. Source data
Extended Data Fig. 7
Extended Data Fig. 7. LONP1 deficient β-cells display diminished glucose-stimulated bioenergetics and cytosolic Ca2+ without changes in mitochondrial Ca2+.
(a) Relative ATP levels (normalized to total protein) in islets isolated from 6-week-old mice following exposure to 2 mM glucose (2G) and 17 mM glucose (17G) stimulation. n = 5 Ctrl vs 3 β-LonP1KO mice; *P < 0.01 by one-way ANOVA followed by Tukey’s multiple comparisons test. (b) Representative fluorescence images of Ca2+uptake in islets from 8-week-old control (Ctrl) (i–iv) and β-LonP1KO (v–viii) littermates transduced with the mitochondrial Ca2+ indicator mito-R-Geco (purple) and loaded with the cytosolic Ca2+ indicator Cal520 (green) at indicated time points. Scale bar, 10 μm. Subsequent analyses were performed by capturing images across the whole islet (c, d), or only in those individual cells where both Cal520 and R-Geco fluorescence were detectable initially (e, f). (c) Whole islet [Ca2+]cyt changes and corresponding area under curve (AUC) in response to 3, 11 and 17 mmol/l glucose (3G, 11G and 17G) and 20 mmol/l KCl following Cal520 uptake. Traces represent mean normalized fluorescence intensity over time (F/Fmin). n = 12 islets/group (4 mice/group). 11 G AUC measured between time 3–18 min, 17 G AUC measured between time 18–33 min. (d) Whole islet [Ca2+]mito changes and corresponding AUC in response to 3, 11 and 17 mmol/l glucose and 20 mmol/l KCl following mito-R-Geco transduction. n = 12 islets/group (4 mice/group). (e) [Ca2+]cyt and (f) [Ca2+]mito dynamics and corresponding AUC from individual cells for each islet in response to 3, 11 and 17 mmol/l glucose and 20 mmol/l KCl. Traces represent mean normalized fluorescence intensity over time (F/Fmin). n = 84 cells/Ctrl group, n = 41 cells/ β-LonP1KO group (4 mice/group). 11 G AUC measured between time 3–18 min, 17 G AUC measured between time 18–33 min. All data in figure are presented as mean ± SEM. Statistical analysis: 7 C and 7E, *P < 0.05, **P < 0.01 by unpaired two-tailed Student’s t-test. Source data
Extended Data Fig. 8
Extended Data Fig. 8. Examination of relative single cell cytosolic and mitochondrial Ca2+ concentrations as well as mitochondrial membrane potential following β-cell LONP1 deficiency.
(a) [Ca2+]cyt (left) and [Ca2+]mito (right) changes were simultaneously assessed in individual cells from the same control islet following cytosolic Cal520 uptake and mito-R-Geco transduction in response to 3, 11, and 17 mM glucose (3 G, 11 G and 17 G) and 20 mM KCl. (n = 5 cells, each color represents one cell). (b) [Ca2+]cyt (left) and [Ca2+]mito (right) changes were simultaneously assessed in individual cells from the same β-LonP1KO islet following cytosolic Cal520 uptake and mito-R-Geco transduction in response to 3, 11, and 17 mM glucose (3 G, 11 G and 17 G) and 20 mM KCl (n = 4 cells, each color represents one cell). (c) Δψm measured in dissociated β-cells loaded with 10 nM TMRM following exposure to 3- and 17-mM glucose (3 G and 17 G), or 1 µM FCCP. Traces represent normalized fluorescence intensity over time (F/Fmin) n = 120 islets/group (3 mice/group). Pink dashed box highlights changes in Δψm before and after FCCP exposure. (d) Change in Δψm post FCCP, measured as the difference between Δψm from time 13–13.5 min (after 1 µM FCCP exposure) and time 12.5–13 min (prior to FCCP) corresponding to pink dashed box in Extended Data Fig. 8c. Each dot represents an individual cell. n = 103 cells/Ctrl group, n = 104 cells/ β-LonP1KO group (3 mice/group). All data in figure are presented as mean ± SEM. Statistical analysis: 10D, **P < 0.01 by unpaired two-tailed Student’s t-test. Source data
Extended Data Fig. 9
Extended Data Fig. 9. LonP1 deficiency leads to abnormal mitochondrial morphology and a decline of mitochondrial mass.
(a) Imaris® generated three-dimensional reconstruction of deconvolution immunofluorescence Z-stack images at 60x magnification in pancreatic sections of 6-week-old mice. Each unique color represents a separate β cell mitochondrial network cluster. (b) β cell mitochondrial morphology and network analysis of deconvolution immunofluorescence Z-stack images at 60X magnification from pancreatic sections of 6-week-old mice by Mitochondria Analyzer. n = 6 mice/group. (c) Quantitative RT-PCR of markers of ER stress from RNA isolated from 6-week-old islets. n = 4 Ctrl vs 3 β-LonP1KO mice. (d) Representative WB images and (e) quantification of OXPHOS complex subunits and TOM20 in isolated islets from mice at both 4-weeks and 6-weeks of age. n = 7 Ctrl vs 7 β-LonP1KO mice at 4 weeks; n = 5 Ctrl vs 5 β-LonP1KO mice at 6 weeks. (f) Relative mtDNA content normalized to nuclear DNA expression measured by qPCR in isolated islets of mice at both 4-weeks (left) and 6-weeks (right) of age. n = 4 Ctrl vs 4 β-LonP1KO mice at 4 weeks; n = 5 Ctrl vs 4 β-LonP1KO mice at 6 weeks. (g) Citrate synthase activity measured in isolated islets of mice at both 4-weeks (left) and 6-weeks (right) of age. n = 3 Ctrl vs 3 β-LonP1KO mice at 4 weeks; n = 4 Ctrl vs 3 β-LonP1KO mice at 6 weeks. (h) Representative images (left) and quantification (right) of LONP1 levels in Min6 β-cells 72 h after transfection with siLonP1 or siCtrl. n = 6 independent experiments/group. (i) Representative images (left) and quantification (right) of phospho-γH2AX expression in isolated islets of 4-week-old mice. n = 4 mice/group. All data in figure are presented mean ± SEM. Statistical analysis: 9B, 9 C, 9E, 9 F, 9 G, and 9H, *P < 0.05, **P < 0.01 by unpaired two-tailed Student’s t-test. Source data
Extended Data Fig. 10
Extended Data Fig. 10. Examination of LONP1 activity, interaction with mtHSP70, pharmacologic activation, and transcriptional regulation in pancreatic β-cells.
(a) Representative WB images (left) and quantification (right) of FLAG-epitope tagged LONP1, total LONP1, HMGCS2, and TWINKLE expression in Min6 β-cells 72 h after transfection with pQCXIP vectors expressing a FLAG-tagged empty vector (EV), wild-type LONP1 (WT), or LONP1 S855A mutant (S855A). VINCULIN serves as a loading control. n = 3 independent experiments/group. (b) Representative WB of lysates of Min6 β-cells following control anti-IgG immunoprecipitation (IP; middle lane) or anti-LONP1 IP (right lane). n = 4 independent experiments/group. (c) Aconitase activity measured in Min6 β-cells exposed to 0.3 μM MKT077 or DMSO for 24 h. n = 3/group. (d) TFAM and LONP1 protein levels visualized by WB (Left) and densitometry (Right) of recombinant purified human TFAM and LONP1 to assess LONP1 protease activity in the presence of 40 μM 84-B10 or vehicle control (DMSO). LONP1 protein levels serve as a reference/loading control. n = 3 independent experiments/group. (e) Immunofluorescence imaging performed in human β-cell enriched pseudoislets, generated by magnetic sorting for the β cell surface marker NTPDase3, following dissociation for cytocentrifugation and imaging, stained for insulin (red) and DAPI (DNA - blue). Scale bars, 50 μm. Representative image of 4 β-cell enriched pseudoislet preparations each from independent human islet donors. (f) Pseudobulk gene expression data of reported transcriptional regulators of LONP1 from β cells of human islet donors with or without T2D by single cell RNA sequencing. Box plots are presented the minimum, first quartile, median, third quartile, maximum, and interquartile range. n = 17 non-diabetic donors, n = 17 donors with T2D. All data in figure are presented mean ± SEM. Statistical analysis: 10 A, 10D, *P < 0.05 by one-way ANOVA followed by Tukey’s multiple comparisons test. 10 C, *P < 0.05 by unpaired two-tailed Student’s t-test. Source data

Update of

References

    1. López-Otín, C., Blasco, M. A., Partridge, L., Serrano, M. & Kroemer, G. Hallmarks of aging: an expanding universe. Cell186, 243–278 (2023). - PubMed
    1. Kaushik, S. & Cuervo, A. M. Proteostasis and aging. Nat. Med.21, 1406–1415 (2015). - PubMed
    1. Mukherjee, A., Morales-Scheihing, D., Butler, P. C. & Soto, C. Type 2 diabetes as a protein misfolding disease. Trends Mol. Med.21, 439–449 (2015). - PMC - PubMed
    1. Marzban, L., Park, K. & Verchere, C. B. Islet amyloid polypeptide and type 2 diabetes. Exp. Gerontol.38, 347–351 (2003). - PubMed
    1. Arunagiri, A. et al. Proinsulin misfolding is an early event in the progression to type 2 diabetes. eLife8, e44532 (2019). - PMC - PubMed

MeSH terms

Grants and funding

LinkOut - more resources