. 2025 Jul 21;8(1):1083.
doi: 10.1038/s42003-025-08509-7.

Development of areal-level individualized homologous functional parcellations in youth

Affiliations

Development of areal-level individualized homologous functional parcellations in youth

Jinlong Li et al. Commun Biol. .

Abstract

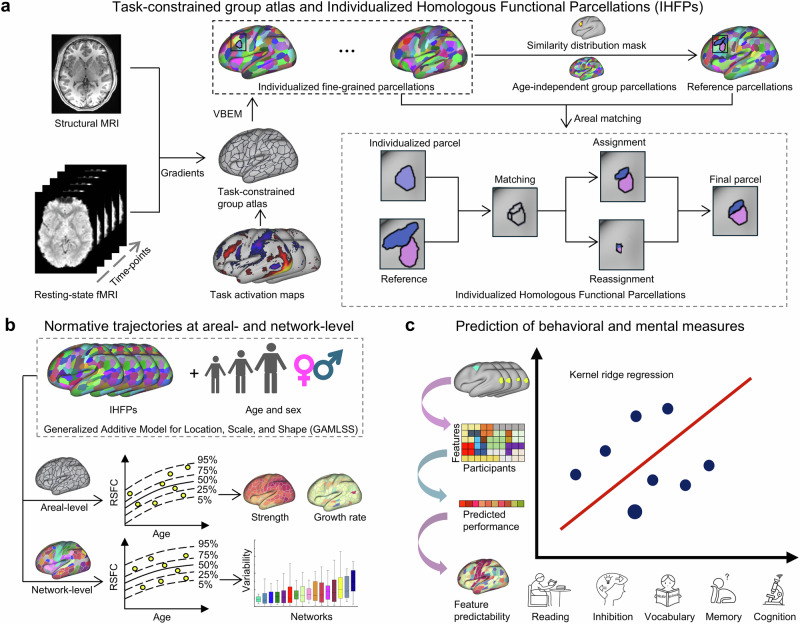
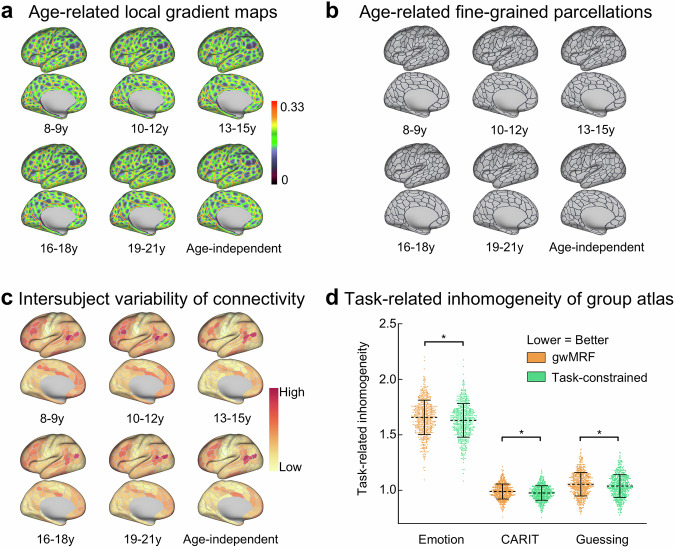
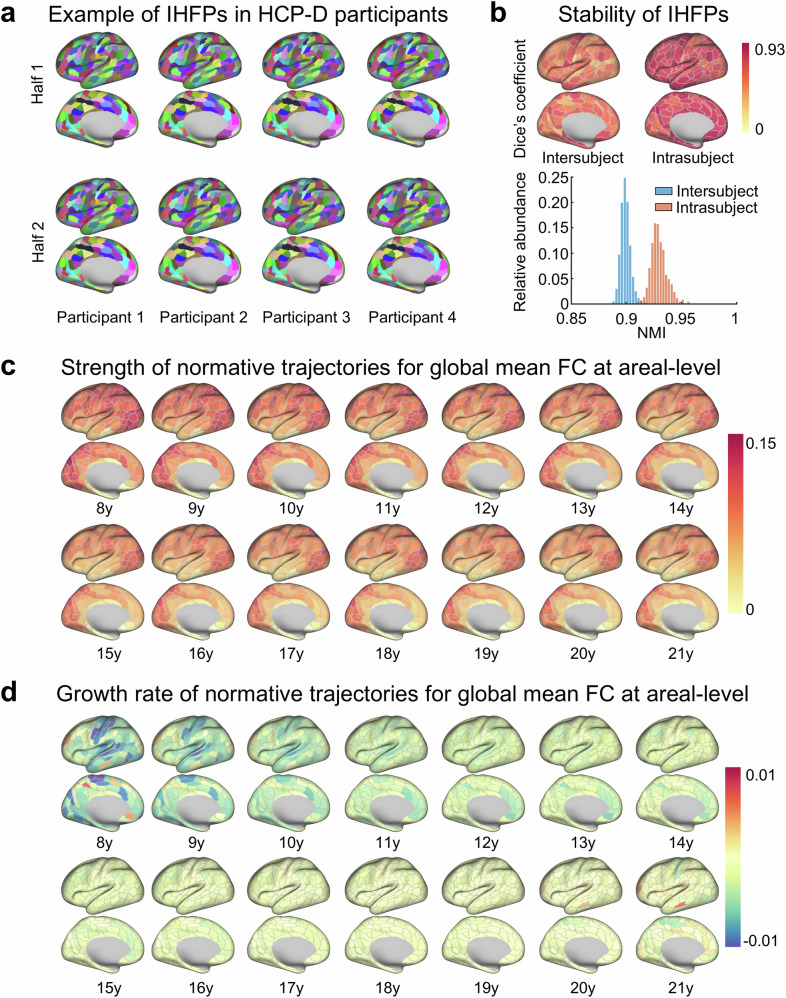
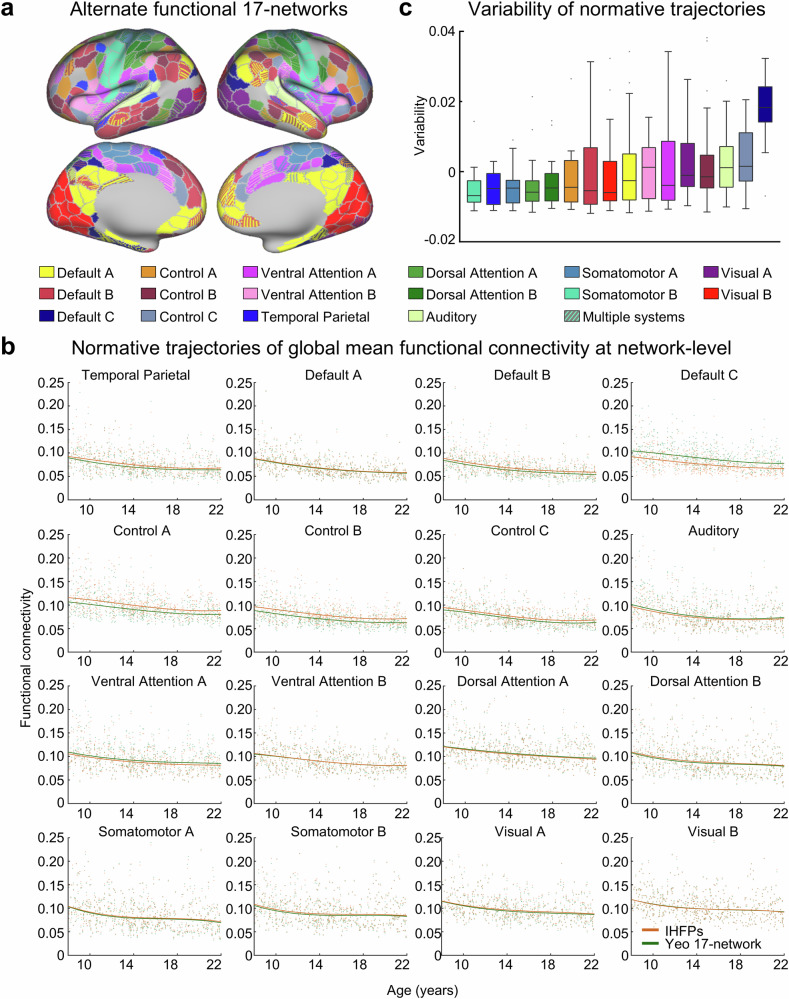
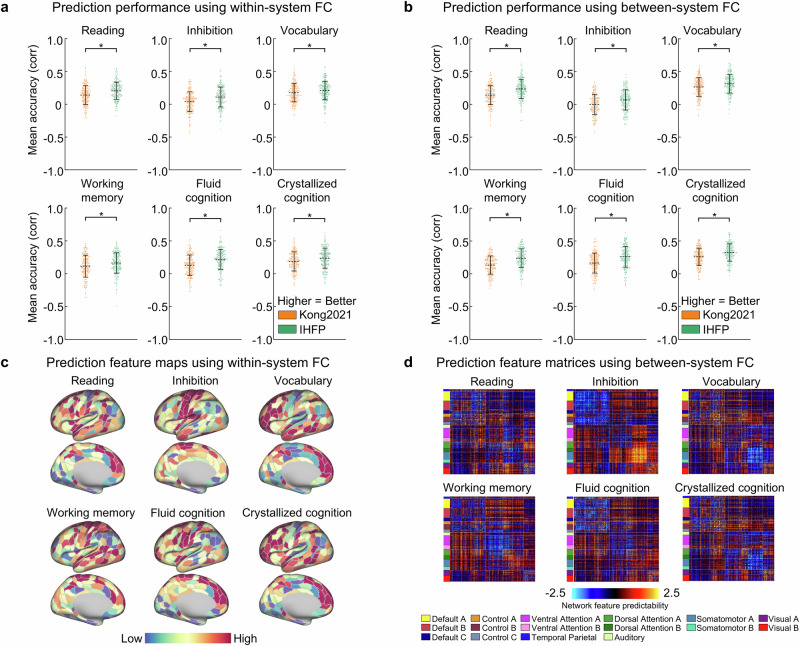
Individualized functional brain networks from childhood to adolescence undergo varying patterns of maturation, associated with higher-order cognition outcomes. However, the developmental trajectory patterns based on homologous areal-level brain parcellations remain elusive. Here, we developed an individualized homologous functional parcellation technique (IHFP) to map brain functional development using resting-state functional magnetic resonance imaging data from the Lifespan Human Connectome Project in Development study (N = 591) aged 8-21 years. We delineate developmental trajectories based on areal-level homologous parcellations of resting-state functional connectivity. We found functional features during adolescence exhibit unique developmental trajectories, such as global mean functional connectivity with a widespread decrease across cerebral cortex. Then, we matched areal-level parcellations into large-scale networks and demonstrated that higher-order transmodal networks exhibited higher variability between developmental trajectories in areal-level parcels. We reveal that IHFPs possess a stronger capability for creating more homogeneous parcels in individuals, consequently showing a higher accuracy in predicting cognition behaviors. Together, these results establish the fine-grained areal-level functional homologous parcellations in adolescent development and will facilitate the understanding of human brain function more precisely.


Conflict of interest statement

Competing interests: The authors declare no competing interests.

Figures

Fig. 1
Fig. 1. Study design overview and methodological approach.
a We included structural and functional fMRI images from 591 typically developing subjects aged 8–21 years from the HCP-D dataset. First, task activation maps were integrated into the gradient-weighted Markov Random Field (gwMRF) model to constrain group-level parcellations. Then, individualized homologous functional parcellations (IHFPs) were constructed using a variational Bayes expectation-maximization (VBEM) algorithm,, with areal matching procedures aligned to reference parcellations. For more details, please see Supplementary Fig. 2. b Resting-state functional connectivity can provide a criterion for characterizing functional development. Then, we leverage GAMLSS to calculate the developmental trajectories of areal- and network-level functional connectivity and quantify the whole-brain distribution of its mean strength and growth rate. c We developed prediction models based on the within-system and between-system functional connectivity of IHFPs to predict adolescent cognitive behaviors. These models were compared to state-of-the-art individualized functional parcellations proposed by Kong et al. (noted as Kong2021). We selected 6 cognitive behaviors that stable and well-performed documented in previous studies,,, including reading, inhibition, vocabulary, working memory, fluid cognition, and crystallized cognition in predict models.
Fig. 2
Fig. 2. The local gradient maps and group-level parcellations of HCP-D dataset.
a Age-related local gradient maps computed by averaging individual local gradient maps after co-registering, as described in Wang et al.. Only the left hemisphere is shown for visualization purposes; parcellations in right hemisphere are also identified, as shown in Supplementary Fig. 4a. b Age-related fine-grained parcellations were derived from local gradient maps, task-fMRI and RSFC patterns using the gwMRF (right hemisphere are shown in Supplementary Fig. 4c). c Mean intersubject variability of functional connectivity based on age-related and age-independent group-level parcellations was averaged within each age group, corrected by regressing out the mean intrasubject variability. Right hemisphere’s intersubject functional connectivity variability is shown in Supplementary Fig. 4d. d Task-related inhomogeneity, measured by the standard deviation of task fMRI activation within each parcel, was compared between gwMRF and our task-constrained gwMRF age-related parcellations. Lower task-related inhomogeneity indicates higher functional homogeneity. Distribution of data points was represented as each individual’s task-related inhomogeneity. Statistical significance assessed using a two-tailed paired t-test, *P < 0.001. y, year.
Fig. 3
Fig. 3. Strength and growth rate of developmental trajectories in youth based on IHFPs at areal-level.
a Example of areal-level parcellations constructed using the IHFP technique. Resting-state fMRI timeseries were split in half, with parcellations generated from each half of the timeseries. b Stability of IHFPs was assessed using the Dice’s coefficient and NMI across intrasubject and intersubject homologous parcels. c Strength of normative trajectories of global mean functional connectivity was quantified as the 50th percentile at each age and visualized on the cortex using the age-independent group-average parcellation. d Growth rate of normative trajectories of global mean functional connectivity was quantified as the first derivative of the 50th percentile at each age and visualized on the cerebral cortex using the age-independent group-average parcellation. Only left hemisphere is shown here; right hemisphere is displayed in Supplementary Fig. 5. NMI, normalized mutual information; y year.
Fig. 4
Fig. 4. Fine-grained areal-level IHFPs assigned to canonical 17-networks.
a Alternate functional 17-networks parcellation calculated by averaging the network-assigned IHFPs (with threshold from 98% to 86% in 2% decrements in Supplementary Fig. 3). Striped colors indicate parcels that are assigned to multiple networks during the assignment procedure. b Normative trajectories of global mean functional connectivity for each assigned network based on IHFPs and Yeo 17-network parcellations. These results indicate that the system-level normative model trajectories exhibit high reproducibility in IHFPs compared with group averaged parcellation. c Variability of normative trajectories of global mean functional connectivity, represented by the mean absolute deviation of each parcel’s global mean functional connectivity related to its corresponding functional network, regressed out the number of parcels assigned to each network. Compared to group averaged large-scale network parcellations, the normative model trajectories based on IHFPs exhibit spatial heterogeneity at the system level. Data points for constructing box plots were calculated as variability for each parcel’s trajectory corresponding to network-level trajectory.
Fig. 5
Fig. 5. Prediction performance and features for behavioral measures using kernel ridge regression.
a Prediction performance using within-system functional connectivity based on the Kong2021 atlas and our IHFPs. The behavioral measures include reading, inhibition, vocabulary, working memory, fluid cognition, and crystallized cognition. b Prediction performance using between-system functional connectivity based on Kong2021 atlas and our IHFPs. Distribution of data points was calculated through 20 random replications of 10-fold nested cross-validation, resulting in 200 predictions. c Predictive-feature metrics for each behavioral measure using within-system functional connectivity, with gray lines depicting parcellation boundaries. Right hemisphere is displayed in Supplementary Fig. 11. d Prediction feature maps when using between-system functional connectivity to predict behavioral measures, with white lines depicting network boundaries. For visualization, the values within each matrix of feature predictability were divided by their standard deviations (across all entries in the matrix). *P < 0.0001, two-tailed paired t-test.

Similar articles

References

    1. Eickhoff, S. B., Yeo, B. T. & Genon, S. Imaging-based parcellations of the human brain. Nat. Rev. Neurosci.19, 672–686 (2018). - PubMed
    1. Lawrence, R. M. et al. Standardizing human brain parcellations. Sci. Data8, 78 (2021). - PMC - PubMed
    1. Hermosillo, R. J. et al. A precision functional atlas of personalized network topography and probabilities. Nat. Neurosci.27, 1000–1013 (2024). - PMC - PubMed
    1. Dworetsky, A. et al. Two common and distinct forms of variation in human functional brain networks. Nat. Neurosci.27, 1187–1198 (2024). - PMC - PubMed
    1. Nettekoven, C. et al. A hierarchical atlas of the human cerebellum for functional precision mapping. Nat. Commun.15, 8376 (2024). - PMC - PubMed

LinkOut - more resources