. 2025 Sep;31(9):3128-3140.
doi: 10.1038/s41591-025-03799-0. Epub 2025 Jul 21.

Modulation of metabolic, inflammatory and fibrotic pathways by semaglutide in metabolic dysfunction-associated steatohepatitis

Affiliations

Modulation of metabolic, inflammatory and fibrotic pathways by semaglutide in metabolic dysfunction-associated steatohepatitis

Maximilian Jara et al. Nat Med. 2025 Sep.

Abstract

Metabolic dysfunction-associated steatohepatitis (MASH) is a chronic liver disease strongly associated with cardiometabolic risk factors. Semaglutide, a glucagon-like peptide-1 receptor agonist, improves liver histology in MASH, but the underlying signals and pathways driving semaglutide-induced MASH resolution are not well understood. Here we show that, in two preclinical MASH models, semaglutide improved histological markers of fibrosis and inflammation and reduced hepatic expression of fibrosis-related and inflammation-related gene pathways. Aptamer-based proteomic analyses of serum samples from patients with MASH in a clinical trial identified 72 proteins significantly associated with MASH resolution and semaglutide treatment, with most related to metabolism and several implicated in fibrosis and inflammation. An independent real-world cohort verified the pathophysiological relevance of this signature, showing that the same 72 proteins are differentially expressed in patients with MASH relative to healthy individuals. Taken together, these data suggest that semaglutide may revert the circulating proteome associated with MASH to the proteomic pattern observed in healthy individuals.


Conflict of interest statement

Competing interests: E.B. has served as a consultant or advisory board member for Boehringer Ingelheim, Gilead, Intercept, Merck, Novo Nordisk, Pfizer and ProSciento and as a speaker for Gilead, Intercept, Merck, Novo Nordisk and Pfizer. E.B. also received a research grant from Gilead for fatty liver research. K.C. has received research support for the University of Florida as principal investigator from Boehringer Ingelheim, Echosens, Inventiva, LabCorp and Perspectum and has served as a consultant for Aligos Therapeutics, Arrowhead, AstraZeneca, 89bio, Bristol Myers Squibb, Boehringer Ingelheim, Eli Lilly, Novo Nordisk, Prosciento, Sagimet Biosciences, Siemens USA and Terns Pharmaceuticals. P.N.N. reports grants from Novo Nordisk and has received consulting fees from Boehringer Ingelheim, Madrigal and Novo Nordisk. P.N.N. also reports honoraria as a speaker from AiCME, Echosens and Novo Nordisk; support for attending meetings from Novo Nordisk; and participation on advisory boards for Boehringer Ingelheim, GlaxoSmithKline, Madrigal, Novo Nordisk and Sagimet. Q.M.A. is supported by the NIHR Newcastle Biomedical Research Centre and the Innovative Medicines Initiative (IMI2) program of the European Union. Q.M.A. has received consulting fees on behalf of Newcastle University from 89bio, Akero, Alimentiv, AstraZeneca, Axcella, Boehringer Ingelheim, Bristol Myers Squibb, Galmed, Genentech, Genfit, Gilead, GlaxoSmithKline, Hanmi, HistoIndex, Intercept, Inventiva, Ionis, IQVIA, Janssen, Madrigal, Medpace, Merck, NGMBio, Novartis, Novo Nordisk, PathAI, Pfizer, Pharmanest, Poxel, Prosciento, Resolution Therapeutics, Ridgeline Therapeutics, Roche, RTI, Shionogi and Terns Pharmaceuticals. He has received payment or honoraria from Fishawack, Integritas Communications, Kenes, Madrigal, Medscape, Novo Nordisk and Springer Healthcare. R.L. has served as a consultant to 89bio, Aardvark Therapeutics, Altimmune, Arrowhead Pharmaceuticals, AstraZeneca, Cascade Pharmaceuticals, Eli Lilly, Gilead, Glympse Bio, Inipharma, Intercept, Inventiva, Ionis, Janssen, Lipidio, Madrigal, Neurobo, Novo Nordisk, Merck, Pfizer, Sagimet, Takeda, Terns Pharmaceuticals and Viking Therapeutics. In addition, his institution received research grants from Arrowhead Pharmaceuticals, AstraZeneca, Boehringer Ingelheim, Bristol Myers Squibb, Eli Lilly, Galectin Therapeutics, Gilead, Intercept, Hanmi, Intercept, Inventiva, Ionis, Janssen, Madrigal Pharmaceuticals, Merck, Novo Nordisk, Pfizer, Sonic Incytes and Terns Pharmaceuticals. He is co-founder of LipoNexus, Inc. V.R. has received consulting fees from Boehringer Ingelheim, GlaxoSmithKline, Madrigal, Novo Nordisk, ProSciento and Sagimet and research grants (to institution) from Merck Sharp & Dohme. V.W.-S.W. has served as a consultant or advisory board member for AbbVie, Boehringer Ingelheim, Echosens, Gilead Sciences, Intercept, Inventiva, Novo Nordisk, Pfizer, Sagimet Biosciences and TARGET PharmaSolutions and as a speaker for Abbott, AbbVie, Gilead Sciences, Novo Nordisk and Unilab. He received a research grant from Gilead Sciences and is a co-founder of Illuminatio Medical Technology Limited. He has received travel support from AbbVie and Gilead Sciences. M.J., J.N., M.S.K., K.A., K.M.B., E.D.G., M.G., L.L.G., L.M.H., G.M., L.M.N., M.S.P., A.-S.S. and L.B.K. are employees and/or stockholders of Novo Nordisk A/S.

Figures

Fig. 1
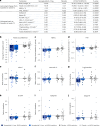
Fig. 1. Mediated (WL) and unmediated (WL-independent) treatment effect on histological improvement with semaglutide versus placebo.
Data were based on complete-case on-treatment measurements (N = 249) for histological parameters that showed a statistically significant effect of semaglutide. Data are shown as odds ratios (ORs) (center point) and 95% CIs. Mediator was WL at weeks 4, 12, 20, 28, 36, 44, 52, 62 and 72. Baseline confounders were age, T2D, fibrosis stage, body weight and gender. WL, weight loss. Source data
Fig. 2
Fig. 2. Improvements in metabolic factors are correlated with MASH resolution without worsening of fibrosis.
a, On-treatment observations using an MMRM. Data are partially presented in the primary publication. Differences between semaglutide and placebo were assessed using a two-sided t-test. HbA1c and FPG are reported in patients with T2D only, and HOMA-IR and Adipo-IR (fasting plasma insulin × FFA) are reported in patients not treated with insulin at baseline. bj, Data for change from baseline are mean ± s.e.m. and, for ratio to baseline, geometric mean ± s.e.m. calculated on a log scale and then back-transformed. Data are from the on-treatment observation period for individuals with available data (complete-case). b, Waist circumference (n = 40, n = 20, n = 14 and n = 49, respectively). c, HbA1c in individuals with and without T2D (n = 39, n = 20, n = 14 and n = 48, respectively). d, FPG in individuals both with and without T2D (n = 40, n = 20, n = 14 and n = 48, respectively). e, HDL-C (n = 40, n = 20, n = 14 and n = 48, respectively). f, Non-HDL-C (n = 40, n = 20, n = 14 and n = 48, respectively). g, Triglycerides (n = 40, n = 20, n = 14 and n = 48, respectively). h, hs-CRP (n = 40, n = 20, n = 14 and n = 48, respectively). i, HOMA-IR in individuals not treated with insulin at baseline (n = 39, n = 19, n = 11 and n = 40, respectively). j, Adipo-IR in individuals not treated with insulin at baseline (n = 39, n = 19, n = 11 and n = 39, respectively). Adipo-IR, adipose tissue insulin resistance (fasting plasma insulin × FFA); ETD, estimated treatment difference; ETR, estimated treatment ratio; FFA, free fatty acids; FPG, fasting plasma glucose; HbA1c, glycated hemoglobin; HDL-C, high-density lipoprotein cholesterol; HOMA-IR, homeostatic model assessment of insulin resistance; hs-CRP, high-sensitivity C-reactive protein; LDL-C, low-density lipoprotein cholesterol; s.e.m., standard error of the mean. Source data
Fig. 3
Fig. 3. Improvements in MASH with semaglutide assessed by aptamer-based SomaSignal NASH tests.
a, Proportion of individuals with improvement in each MASH component. Improvement was defined as a negative SomaSignal test at week 72 in individuals with a positive test at baseline. Proportions of individuals with improvement were compared between semaglutide and placebo by a linear-by-linear association test for ordered data. ***P < 0.001. Analysis was two-sided with estimated treatment ratios derived from a multivariable-adjusted MMRM, with no adjustment for multiple testing. b, Volcano plots showing the estimated treatment ratio of semaglutide 0.4 mg/placebo and associated P value for all individual markers included in each SomaSignal NASH test. For each marker, the effect of semaglutide 0.4 mg versus placebo was tested in an MMRM analysis. Statistically significant treatment ratios of semaglutide 0.4 mg/placebo were evaluated using a two-sided Bonferroni-adjusted family-wise error rate of <0.1. Filled circles denote statistical significance; open circles denote no statistical significance. The presence of duplicate genes in b is due to two different targets covering the same gene and protein. ACP1, acid phosphatase 1; ACY1, aminoacylase-1; ADAMTSL2, a disintegrin and metalloproteinase with thrombospondin motifs-like protein 2; ADIPOQ, adiponectin; AKR1B10, aldo-keto reductase family 1 member B10; BPIFB1, bactericidal/permeability-increasing-fold-containing family B member 1; C1orf198, uncharacterized protein C1orf198; C7, complement component C7; CCL23, C-C motif chemokine 23; CNDP1, beta-Ala-His dipeptidase; CNN2, calponin-2; COLEC11, collectin-11; CTCF, transcriptional repressor CTCF; CTLA4, cytotoxic T-lymphocyte protein 4; ERN1, serine/threonine-protein kinase/endoribonuclease IRE1; FABP12, fatty acid-binding protein 12; FCGR3B, low-affinity immunoglobulin gamma Fc region receptor III-B; FCRL3, Fc receptor-like protein 3; GH2, growth hormone 2; GRID2, glutamate receptor ionotropic, δ-2; GSTZ1, maleylacetoacetate isomerase; GUSB, β-glucuronidase; HEXB, β-hexosaminidase B; INHBC, inhibin beta C chain; INSL5, insulin-like peptide 5; KDR, vascular endothelial growth factor receptor 2; NFASC, neurofascin; PCOLCE2, procollagen C-endopeptidase enhancer 2; PLOD3, procollagen-lysine, 2-oxoglutarate 5-dioxygenase 3; PTGR1, prostaglandin reductase 1; PYY, peptide YY; RECQL, ATP-dependent DNA helicase Q1; RPN1, dolichyl-diphosphooligosaccharide–protein glycosyltransferase subunit 1; SAA2, serum amyloid A-2 protein; TACSTD2, tumor-associated calcium signal transducer 2; TXNRD1, thioredoxin reductase 1; WNT5A, protein Wnt-5a. Source data
Fig. 4
Fig. 4. Semaglutide treatment effect on biomarkers included in the aptamer-based SomaScan assay.
a, Heatmap showing the 14 markers found to constitute the aptamer-based proteomic signature of semaglutide treatment. Data mining was performed using the repeated LASSO procedure including all 4,979 markers in the SomaScan assay as input. For each marker, change from baseline at week 72 was used as predictor variable. The heatmap shows individual changes in protein expression from baseline to week 72 on an arbitrary scale. b, Box plot showing the treatment effect of placebo and semaglutide 0.1 mg, 0.2 mg and 0.4 mg on the 14-marker proteomic signature of semaglutide. The treatment effect was calculated from the average LASSO coefficients for each of the 14 markers and is presented on an arbitrary scale. The number of patients is the on-treatment population for each treatment group. a.u., arbitrary units. c, Volcano plot showing the estimated treatment ratio of semaglutide 0.4 mg/placebo at week 72 and associated P value for all 4,979 individual markers included in the SomaScan assay. For each marker, the effect of semaglutide 0.4 mg versus placebo was tested in an MMRM analysis. Statistically significant treatment ratios of semaglutide 0.4 mg/placebo were evaluated using a two-sided Bonferroni-adjusted family-wise error rate of <0.1. Blue dots denote statistical significance; gray dots denote no statistical significance. Red circles show the 14 markers included in the proteomic signature of semaglutide treatment (see b). ACAN, aggrecan core protein; ADAMTSL2, a disintegrin and metalloproteinase with thrombospondin motifs-like protein 2; CD163, scavenger receptor cysteine-rich type 1 protein M130; CHAD, chondroadherin; CRISP2, cysteine-rich secretory protein 2; LECT2, leukocyte cell-derived chemotaxin-2; MLN, promotilin; PNLIPRP1, inactive pancreatic lipase-related protein 1; PRSS2, trypsin-2; PRSS3, trypsin-3; PTGR1, prostaglandin reductase 1; REG3A, regenerating islet-derived protein 3 alpha; RET, (REarranged during Transfection) receptor tyrosine kinase; SHBG, sex hormone-binding globulin. Source data
Fig. 5
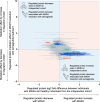
Fig. 5. Change in protein levels of participants with MASH treated with semaglutide compared to protein levels in healthy volunteers in an independent real-world observational cohort.
a. Left-hand panel shows abundance of SERPINC1 from healthy individuals and those with MASH in the independent cohort. Center of box plot is median; box boundary is first and third quantiles; upper whisker is third quantile plus 1.5 IQR; and lower whisker is first quantile minus 1.5 IQR, where IQR is the third quantile minus the first quantile (healthy, n = 89; MASH, n = 146). The right-hand panel shows the effect of semaglutide treatment on SERPINC1 levels in patients with MASH from a phase 2 trial population (semaglutide 0.1 mg (n = 80), semaglutide 0.2 mg (n = 78), semaglutide 0.4 mg (n = 82) and placebo (n = 80)). bd, As for a but showing levels of APOF, ADAMTS2 and ACY1, respectively. No technical replicates were used. Data are presented as mean + s.e.m. ADAMTSL2, a disintegrin and metalloproteinase with thrombospondin motifs-like protein 2; APOF, apolipoprotein F; ACY1, aminoacylase-1; IQR, interquartile range; SERPINC1, serpin family C member 1. s.e.m., standard error of the mean. Source data
Extended Data Fig. 1
Extended Data Fig. 1. Weight loss effect of semaglutide on MASH resolution (a), steatosis improvement (b), hepatocyte ballooning (c) and liver fibrosis improvement (d).
Data based on complete-case on-treatment measurements. Scatter points show responder rates for five weight-loss categories. Enlarged data points show the overall mean body-weight loss versus overall responder rate. Outcome model: logistic regression at week 72. Mediators: weight loss at weeks 4, 12, 20, 28, 36, 44, 52, 62 and 72. Baseline confounders: age, gender, type 2 diabetes status, fibrosis stage and body weight. MASH, metabolic dysfunction-associated steatohepatitis; WL, weight loss. Source data
Extended Data Fig. 2
Extended Data Fig. 2. SomaSignal NASH tests for steatosis (a), inflammation (b), ballooning (c) and fibrosis (d) show a dose-dependent response to semaglutide treatment.
The full population was analyzed. No technical replicates were used. Error bars are geometric means with standard error of the mean. MASH, metabolic dysfunction-associated steatohepatitis; N, number of observations; OD, once daily; Sema, semaglutide. Source data
Extended Data Fig. 3
Extended Data Fig. 3. Treatment effects in the semaglutide 0.4 mg group versus the placebo group at weeks 28, 52 and 72 for each of the four SomaSignal NASH tests.
Mixed model for repeated measurements. Data are presented as estimated treatment ratio and 95% confidence intervals. For each component of MASH, the number of patients at week 28, 52 and 72 was 63, 65 and 67, respectively. MASH, metabolic dysfunction-associated steatohepatitis; OD, once daily. Source data
Extended Data Fig. 4
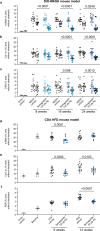
Extended Data Fig. 4. Semaglutide treatment in DIO-MASH and CDA-HFD mice: effects of treatment duration on liver fibrosis.
Effects of once-daily subcutaneous semaglutide on fibrogenesis/fibrosis markers αSMA (a, d), Col-I α1 (b, e) and PSR (c, f) in DIO-MASH mice (a-c) and CDA-HFD mice (d-f). DIO-MASH: Open symbols show pretreatment values. Chow vehicle (grey triangles) for 24 weeks (n = 9), MASH vehicle and semaglutide 123 µg/kg for 8 weeks (n = 16 [black triangles] and n = 16 [light blue circles], respectively), 16 weeks (n = 16 [black triangles] and n = 16 [blue rectangles]), and 24 weeks (n = 15 [black triangles] and n = 15 [dark blue square]). Differences between semaglutide and DIO-MASH vehicle were assessed using Welch’s unpaired t-test, two tailed. CDA-HFD: Chow vehicle for 12 weeks (n = 5 [grey triangles]), baseline prior to treatment (n = 10 [grey circles]), CDA-HFD vehicle or semaglutide 20 µg/kg for 6 weeks (n = 15 [black triangles] and n = 13 [blue circles], respectively) and 12 weeks (n = 15 [black triangles] and n = 12 [dark blue triangles], respectively). Differences between semaglutide and CDA-HFD vehicle were assessed using Welch’s unpaired t-test, two tailed. Data are presented as mean values ± s.e.m. αSMA, αsmooth muscle actin; CDA-HFD, choline-deficient L-amino acid-defined high-fat diet; Col-I α1, α-1 type I collagen; DIO, diet-induced obesity; MASH, metabolic dysfunction-associated steatohepatitis; PSR, Picrosirius Red; s.e.m., standard error of the mean. Source data
Extended Data Fig. 5
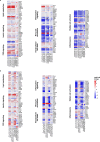
Extended Data Fig. 5. Heatmap depicting relative levels (log fold change) of differentially expressed selected candidate genes associated with MASH and fibrosis in semaglutide-treated DIO-MASH mice (a) and CDA-HFD mice (b).
The liver transcriptome was probed against a selected set of genes involved in lipid metabolism, insulin signaling, FXR signaling, inflammation signaling, monocyte recruitment, hepatocellular cell death and stellate cell activation. Upregulated (red color gradient) and downregulated (blue color gradient) gene expression in individual pathways as compared to the corresponding control group. *P < 0.05 versus DIO-MASH vehicle (a) and CDA-HFD vehicle (b). P values corrected for multiple testing using the Benjamini and Hochberg method. CDA-HFD, choline-deficient L-amino acid-defined high-fat diet; DIO, diet-induced obesity; FXR, farnesoid X receptor; MASH, metabolic dysfunction-associated steatohepatitis; W, week.
Extended Data Fig. 6
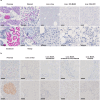
Extended Data Fig. 6. No evidence of GLP-1 receptor expression in mouse and human liver.
a, Assessment of GLP-1 receptor protein expression in mouse tissue samples by immunohistochemistry. Representative photomicrographs of sections of positive control tissues from C57Bl/6 normal mouse (pancreas, stomach, duodenum and kidney) all showed immunoreactive cell populations. Samples of normal liver (chow; n = 1) and livers from DIO-MASH (n = 4) and CDA-HFD mice (n = 4) are all devoid of GLP-1 receptor immunoreactivity. Scale bars, 50 µm (control tissues and bottom images of liver) or 250 µm (top images of liver). b, Assessment of GLP-1 receptor mRNA and protein expression in human liver by RNAscope in situ hybridization (top row) and immunohistochemistry (bottom row) on human tissue samples. Representative photomicrographs of sections of normal-range liver biopsies (n = 6) and liver biopsies from individuals with MASH and mild fibrosis (n = 7), moderate to severe fibrosis (n = 6) or cirrhosis (n = 7). Normal-range human pancreas sample served as a positive control for GLP-1 receptor expression (left). Scale bars, 50 µm. CDA-HFD, choline-deficient L-amino acid-defined high-fat diet; DIO, diet-induced obesity; GLP-1, glucagon-like peptide-1; MASH, metabolic dysfunction-associated steatohepatitis. Source data
Extended Data Fig. 7
Extended Data Fig. 7. Change in protein levels in participants with MASH treated with semaglutide compared with protein levels in healthy volunteers in an independent real-world observational cohort.
Gray-colored data points and error bars represent the full complement of aptamer-based SomaScan proteins; blue-colored points and error bars are those proteins significantly associated with semaglutide-induced MASH resolution; proteins of interest in the current work are highlighted in orange and green. The vertical axis represents the mediation effect on protein biomarkers from the SomaScan analysis with respect to semaglutide-induced MASH resolution. The horizontal axis displays the log2 fold changes in protein levels between healthy individuals and those with MASH in the independent CoCoMASLD cohort, while accounting for the effect of gender, age, body mass index and diabetes status. Source data
Extended Data Fig. 8
Extended Data Fig. 8. Change in AKR1B10, TREM2 and CFHR4 protein levels in participants with MASH treated with semaglutide compared with protein levels in healthy volunteers in an independent real-world observational cohort.
a. Left-hand panel shows abundance of AKR1B10 from healthy individuals and those with MASH in the independent cohort. Center of boxplot is median, box boundary is first and third quantile, upper whisker is third quantile plus 1.5 IQR and lower whisker is first quantile minus 1.5 IQR, where IQR is third quantile minus first quantile (healthy, n = 89; MASH, n = 146). The right-hand panel shows the effect of semaglutide treatment on AKR1B10 levels in patients with MASH from a phase 2 trial population (semaglutide 0.1 mg [n = 80], semaglutide 0.2 mg [n = 78], semaglutide 0.4 mg [n = 82] and placebo [n = 80]). b and c, as for panel a but showing levels of TREM2 and CFHR2, respectively. Data are presented as mean + s.e.m. MASH, metabolic dysfunction-associated steatohepatitis; RFU, relative fluorescence units; s.e.m., standard error of the mean. Source data

References

    1. European public assessment report for Ozempic. European Medicines Agencyhttps://www.ema.europa.eu/en/medicines/human/EPAR/ozempic (2017).
    1. Product information - Wegovy. European Medicines Agencyhttps://www.ema.europa.eu/en/medicines/human/EPAR/wegovy (2023).
    1. Povsic, M., Wong, O. Y., Perry, R. & Bottomley, J. A structured literature review of the epidemiology and disease burden of non-alcoholic steatohepatitis (NASH). Adv. Ther.36, 1574–1594 (2019). - PMC - PubMed
    1. Rinella, M. E. et al. A multisociety Delphi consensus statement on new fatty liver disease nomenclature. J. Hepatol.79, 1542–1556 (2023). - PubMed
    1. Newsome, P. N. et al. A placebo-controlled trial of subcutaneous semaglutide in nonalcoholic steatohepatitis. N. Engl. J. Med.384, 1113–1124 (2021). - PubMed

MeSH terms

LinkOut - more resources