. 2025 Aug;57(8):1966-1980.
doi: 10.1038/s41588-025-02265-4. Epub 2025 Jul 21.

NKX2-1 drives neuroendocrine transdifferentiation of prostate cancer via epigenetic and 3D chromatin remodeling

Affiliations

NKX2-1 drives neuroendocrine transdifferentiation of prostate cancer via epigenetic and 3D chromatin remodeling

Xiaodong Lu et al. Nat Genet. 2025 Aug.

Abstract

A substantial amount of castration-resistant prostate cancer (CRPC) progresses into a neuroendocrine (NE) subtype, known as NEPC, which is associated with poor clinical outcomes. Here we report distinct three-dimensional chromatin architectures between NEPC and CRPC tumors, which were recapitulated by isogenic cell lines undergoing NE transformation (NET). Mechanistically, pioneer factors such as FOXA2 initiate binding at NE enhancers to mediate regional DNA demethylation and induce neural transcription factor (TF) NKX2-1 expression. NKX2-1 preferentially binds gene promoters and interacts with enhancer-bound FOXA2 through chromatin looping. NKX2-1 is highly expressed in NEPC and indispensable for NET of prostate cancer. NKX2-1/FOXA2 further recruits p300/CBP to activate NE enhancers, and pharmacological inhibition of p300/CBP effectively blunts NE gene expression and abolishes NEPC tumor growth. Taken together, our study reports a hierarchical network of TFs governed by NKX2-1 in critically regulating chromatin remodeling and driving luminal-to-NE transformation and suggests promising therapeutic approaches to mitigate NEPC.


Conflict of interest statement

Competing interests: All authors declare no competing interests.

Figures
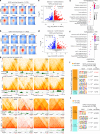
Fig. 1
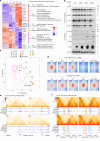
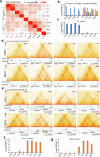
Fig. 1. Distinct 3D chromatin architecture in NEPC compared to CRPC tumors.
a,b, APA plots of NEPC-enriched (a) and CRPC-enriched (b) loops in NEPC (LuCaP93, 145.1, 145.2, and NCI-H660) and CRPC samples (LuCaP35CR, 70CR, 77CR, 147). The APA score is annotated within each plot. Scale bars indicate log2 of observed over expected enrichment. P = 0.026 and P = 0.022, respectively, for NEPC- and CRPC-enriched loop APA scores between NEPC and CRPC samples. P values by one-sided Student’s t test. c, Volcano plot showing genes linked to NEPC-enriched loops that are differentially expressed in NEPC versus CRPC using P < 0.05 (two-sided t test) and log2(FC) ≥ 1. d, Volcano plot of genes linked to CRPC-enriched loops and are differentially expressed in CRPC versus NEPC using P < 0.05 (two-sided t test) and log2(FC) ≥ 1. e,f, GO analyses of genes linked to NEPC-enriched (e) and CRPC-enriched (f) loops and are upregulated in NEPC and CRPC, respectively, as defined in c and d. g,h, Hi-C contact maps (5 kb resolution) of the HOXB gene cluster (g) and AR gene region (h) in CRPC (top row) and NEPC (bottom row) models. Gene boxes and 1D ChIP–seq tracks of matched models are aligned at the bottom. Blue arrows in g indicate NEPC-enriched loops at the HOXB1–HOXB9 loci, and black arrows indicate CRPC-enriched loops at the HOXB13 locus. The scale bars indicate ICE-normalized contact frequency. i,j. The bar graphs showing the percentage of NEPC-enriched (i) or CRPC-enriched (j) loop anchors that overlap with previously reported NE-enriched CREs (n = 14,985) and Ad-CREs (n = 4,338). The enriched motifs at overlapped anchors are shown on the right. P values by one-sided permutation test (without multiple comparisons) to evaluate the significant differences of the indicated overlap relative to control regions of equal size.
Fig. 2
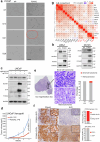
Fig. 2. 3D chromatin reorganization in isogenic PCa cells undergoing NET.
a, Heatmap shows six clusters of genes differentially expressed over the time course (adjusted P < 0.0001). Representative genes and significantly enriched molecular concepts are shown on the right. Bulk RNA-seq was performed in LNCaP cells with FOXA2 OE at the indicated time points. Color bar—z score. Adjusted P values were calculated using the likelihood ratio test, followed by Benjamini–Hochberg correction. b, WB analyses of luminal and NE lineage markers in time-course LNCaP+FOXA2 cells. LNCaP cells were infected with control (plv) or FOXA2 virus and followed up for 28 days. Data shown are from one of three (n = 3) independent experiments. c, Integrative analyses of ARS and NES scores in time-course LNCaP+FOXA2 samples and those of clinical PCa samples (GSE126078). ARS and NES scores were calculated by gene set variation analysis. d, APA plots of luminal (top row) and NE (bottom row) loops (D28 versus D0) in time-course LNCaP+FOXA2 samples and NCI-H660. The APA score is annotated within each plot. Scale bars indicate log2 of observed over expected enrichment. e,f. Hi-C contact maps (5 kb resolution) of the AR gene region (e) and the HOXB gene cluster (f) in time-course LNCaP+FOXA2 cells. Gene boxes and 1D ChIP–seq tracks of matched models are aligned at the bottom. Black arrows indicate luminal loops at AR and HOXB13 loci, and blue arrows indicate NE loops at HOXB1–HOXB9 loci. Enhancers are highlighted in light blue, and promoters in light orange color. FOXA2, H3K27ac, H3K4me1, H3K27me3 and CTCF tracks under the D0 contact map used their corresponding ChIP–seq performed in closely related D2 cells. All others were done in conditions exactly matched to Hi-C. The scale bars indicate ICE-normalized contact frequency.
Fig. 3
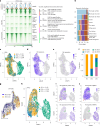
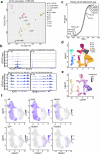
Fig. 3. Single-cell multiome identified transitioning individual cells with intermediate transcriptome and chromatin states.
a, K-means clustering reveals six clusters of differential ATAC–seq peaks (±2 kb) across time-course LNCaP+FOXA2 samples (adjusted P < 0.0001). Heatmaps shown here were scaled across samples. Significantly enriched TF motifs and GO terms for each cluster, along with the number of peaks, are shown on the right. Color bar at the bottom indicates the scale of enrichment intensity. Adjusted P values were calculated using the likelihood ratio test followed by Benjamini–Hochberg correction. b, Genomic distribution of the six clusters of ATAC–seq peaks in a. cf, scRNA-seq UMAP visualization of D0, D14 and D21 LNCaP+FOXA2 cells (c), AR (d) and NE (e) signature genes, which are further quantified for the proportion of AR+/ARS+, AR+/ARS, AR/NES and AR/NES+ cells (f). g, RNA velocity analysis of D14 LNCaP+FOXA2 cells. The data are visualized as streamlines in a UMAP-based embedding. Blue dots indicate KLK3-high cells, and the yellow dots indicate KLK3-low cells. hj, scATAC–seq UMAP visualization of D0, D14 and D21 LNCaP+FOXA2 cells (h), chromatin accessibility (i) and expression (j) of ARS/NES genes. Red and green arrows indicate transitioning D14 and D21 cells, respectively. enhs, enhancers. Source data
Fig. 4
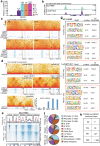
Fig. 4. NKX2-1 is induced by FOXA2 and required for FOXA2-driven NET.
a, Genome browser view of NKX2-1 mRNA (top row), and FOXA2, H3K4me1, H3K27ac ChIP–seq signal around the NKX2-1 gene in time-course LNCaP+FOXA2 cells. The promoter is highlighted in light blue, and enhancers are highlighted in yellow. b, WB of NEPC cell lines (LuNE, NCI-H660) and organoids (LuCaP145.2) with control or FOXA2 KD. Data shown are from one of two (n = 2) independent experiments. LuNE cells—stable LNCaP+FOXA2 cells. c, FOXA2 Co-IP showing its interaction with NKX2-1 protein in NEPC cell line NCI-H660. Data shown are from one of three (n = 3) independent experiments. d, Heatmap showing AR, NKX2-1 and FOXA2 occupancy at previously reported NE-CREs (n = 14,985) and Ad-CREs (n = 4,338) in LNCaP or NEPC models (NCI-H660, LuCaP93, LuCap145.1, LuCaP145.2). Scale bar—enrichment intensity. e, Heatmap showing active (H3K27ac) enhancer (H3K4me1) and promoter (H3K4me3) marks at NKX2-1-only, FOXA2-only and shared binding sites in LuCaP145.1. Scale bar—enrichment intensity. f, APA plots of FOXA2- and NKX2-1-anchored E–P loops identified in D28 in time-course LNCaP+FOXA2 Hi-C samples. The APA score is annotated within each plot. Scale bars indicate log2 of observed over expected enrichment. g, NKX2-1 KD abolished FOXA2-induced NET. LNCaP cells were co-infected with FOXA2 virus along with either sgNC or sgNKX2-1 virus. The infected cells were collected at the indicated time points for WB analyses of luminal and NE markers. The red star indicates a nonspecific band. Data shown are from one of three (n = 3) independent experiments. h, Heatmap showing FOXA2, NKX2-1, H3K27ac and H3K4me1 ChIP–seq around (±2 kb) the six ATAC–seq peak clusters in LNCaP+FOXA2 cells, with or without NKX2-1 KD, at indicated time points. Peaks within each cluster were separately sorted by FOXA2 ChIP–seq intensity. Scale bar—enrichment intensity.
Fig. 5
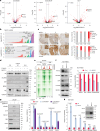
Fig. 5. NKX2-1 is highly expressed in NEPC tumors and accelerates NET of PCa.
a, Volcano plots showing human TFs differentially expressed in CRPC versus NEPC. X axis represents log2 of FC, while the y axis shows −log10 of q values. Each dot represents a TF, red dots—log2(FC) ≥ 1 and adjusted P < 0.05. Adjusted P values by Wald test with Benjamini–Hochberg correction. b, NKX2-1 and FOXA2 gene expression in human PCa samples with distinct expression of AR and NE genes. P values by two-sided Wilcoxon test. c, IHC of NKX2-1 and FOXA2 proteins in clinical CRPC TMAs. Representative IHC images (n = 3) are shown in ×10 with the insets shown in ×40 (left). Scale bar = 100 µm. IHC staining intensities in AR+NE, ARNE, AR+NE+ and ARNE+ samples are quantified on the right. d, Concomitant NKX2-1 OE accelerated FOXA2-driven NET. LNCaP cells were infected with FOXA2, NKX2-1 or both. Cells were collected at the indicated time points and analyzed by WB (n = 3). e, Heatmap showing FOXA2 ChIP–seq in LNCaP cells with OE of FOXA2 alone, or FOXA2 and NKX2-1 at D14 or D28. Peaks were centered around (±2 kb) the six ATAC–seq clusters and sorted by FOXA2 ChIP–seq intensity. Scale bar—enrichment intensity. f, WB (left, n = 3) and RT–PCR (right) showing NKX2-1 KD decreases the expression of NE lineage markers in NCI-H660. NCI-H660 cells were transfected with control or NKX2-1 siRNAs and collected on day 5 after transfection for WB and RT–PCR analyses. RT–PCR data were normalized to GAPDH. Shown are the mean ± s.e.m. of technical replicates from one of three (n = 3) independent experiments. P values by two-sided t test. g, WB (left, n = 3) and RT–PCR (right) showing NKX2-1 KD abolishes RB1/TP53-KD-induced NET. LNCaP cells were co-infected with sgRB1 and sgTP53 virus along with either sgNC or sgNKX2-1 virus. The infected cells were collected at 4 weeks after infection for analyses of NE and stem cell lineage markers. Data of RT–PCR are shown as in f. h, RT–PCR (left) and WB (right, n = 3) showing NKX2-1 OE promotes NET in ENZ-resistant AR+/PSA cell line 42D. The infected cells were collected at 4 weeks after infection for analyses of NE lineage markers. Data of RT–PCR are shown as in f. Source data
Fig. 6
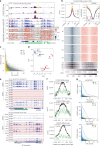
Fig. 6. FOXA2 induces regional DNA demethylation at NE enhancers.
a, IGV view of FOXA2 ChIP–seq (top), mCpG (middle) and single DNA molecules of mCpG and mA (bottom) around the NKX2-1 gene in D2, D14 and D28 LNCaP+FOXA2 cells. Green box—CpG islands. Yellow box—NKX2-1 promoter. b, FOXA2 DiMeLo-seq was performed in D28 LNCaP+FOXA2 cells, and mA and mCpG were called with a probability ≥0.5. Aggregate mA and mCpG curves (top) for each quartile were created with a 50-bp rolling window centered (±1 kb) at D28-specific FOXA2 peaks, which were sorted into four quartiles with q4 comprising the strongest peaks. Inset—a zoomed-in version of the mCpG curves. Heatmap (bottom) shows mA and mCpG on single DNA molecules. A and CG base density (scale bar at the bottom) across the 2 kb region of FOXA2 peaks within each quartile are shown in the 1D heatmaps. Color scales are shown as in a. c, Correlation plots of mA and mCpG counts on the same DNA molecules in D2, D14 and D28 LNCaP+FOXA2 cells. d, PCA analyses of methylation profiles of CRPC, NEPC PDX and D2, D14, D28 LNCaP+FOXA2 samples. DMRs identified between D2 and D28 were used for PCA analysis. e, IGV view of %mCpG in samples named on the left at HOXB2 (top row) and AR promoter (bottom row) region. CpG islands are shown in green. f, FOXA2 DiMeLo-seq showing FOXA2 binding (mA/A) at previously reported Ad-CREs and NE-CREs in NEPC PDX (LuCaP145.1 and LuCaP145.2) and cell line (NCI-H660). g, Correlation plots of mA and mCpG counts on the same DNA molecules in NEPC PDX (LuCaP145.1 and LuCaP145.2) and cell line (NCI-H660). q1 comprises the weakest peaks, and q4 comprises the strongest peaks of FOXA2 based on FOXA2 ChIP–seq signals in respective samples. IGV, integrative genomics viewer; q1, quartile 1; q4, quartile 4.
Fig. 7
Fig. 7. NKX2-1 and FOXA2 recruit p300/CBP to activate NE enhancers and induce NEPC tumor growth, which can be abolished by p300/CBP inhibition.
a, Volcano plot showing FOXA2-interacting proteins in LuNE cells by MS (pooled data from three Co-IP replicates). The x axis represents log2(FC), and the y axis represents −log10P by two-sided t test. Each dot represents a protein. b, Co-IP showing that FOXA2 and NKX2-1 interact with CBP and p300 in LuNE cells. Data shown are from one of three (n = 3) independent experiments. c, Co-IP showing that NKX2-1 interacts with FOXA2 and p300 in NCI-H660 cells. Data are shown as in b (n = 3). d, Heatmaps showing indicated ChIP–seq intensity centered (±2 kb) around the five clusters of FOXA2-binding sites identified in the time-course LNCaP+FOXA2 cells. Scale bar—enrichment intensity. e, Heatmap showing that genes induced by FOXA2 and NKX2-1 (FC ≥ 2 and adjusted P < 0.05) are regulated by p300/CBP in LuNE cells. Data shown is the log2(FC) of sgNKX2-1, sgFOXA2 or sgFOXA2+sgNKX2-1 relative to sgNC, as well as of shp300, shCBP or shp300+shCBP to shCtrl. Adjusted P values by Wald test with Benjamini–Hochberg correction. f, LuNE cells were treated with DMSO or CCS1477 (250 nM) for 72 h. Differentially expressed genes were identified by DESeq2 with FC ≥ 2, adjusted P < 0.05. Color bar—z score. Adjusted P values are calculated as in e. g, GO analysis of CCS1477-repressed genes identified in f. Top enriched molecular concepts are shown on the y axis, while the x axis indicates enrichment. P values by one-sided hypergeometric test. h, Gene set enrichment analysis (GSEA) showing enrichment of SE-associated genes in LuNE cells treated with DMSO or CCS1477. P value by two-sided permutation test with Benjamini–Hochberg correction. i,j. Tumor growth curve (i) and weight (j) of LuNE xenograft tumors treated with vehicle or CCS1477 (n = 6 mice per group). Data are mean ± s.e.m, and P values by two-sided t test. k,l. Tumor growth curve (k) and weight (l) of LuCaP145.2 xenograft tumors treated with vehicle or CCS1477 (n = 6 mice per group in k, n = 7 tumors per group in l). Data are mean ± s.d, and P values by two-sided t test. m, Representative IHC images (n = 6 mice per group) of H3K27ac, SOX2, NKX2-1 and Ki-67 in LuCaP145.2 xenograft tumors treated with vehicle or CCS1477. Scale bar = 30 µm. Insets are shown at higher magnification (×40). Source data
Fig. 8
Fig. 8. Epigenetic remodeling and 3D chromatin reorganization governed by NKX2-1 and FOXA2 drive NE transdifferentiation of PCa.
As a pioneer factor, ectopic FOXA2, once overexpressed in luminal cells, is capable of binding to inaccessible NE lineage enhancers. It induces regional DNA demethylation and increases local chromatin accessibility, thereby activating the expression of NE lineage TFs, such as NKX2-1. Once induced, NKX2-1 preferentially binds to gene promoters and interacts with enhancer-bound FOXA2 through chromatin looping (intermediate stage). This interaction further strengthens FOXA2 occupancy at NE enhancers. Together, FOXA2 and NKX2-1 recruit p300/CBP, which catalyze H3K27 acetylation, further promoting 3D chromatin reorganization, activating NE enhancers and driving the expression of NE lineage-specific transcriptional programs.
Extended Data Fig. 1
Extended Data Fig. 1. Distinct 3D chromatin architecture in NEPC compared to CRPC tumors.
a, Unsupervised hierarchical clustering of Hi-C samples using the top 25% most variable PC1 of Hi-C matrices. CRPC PDXs: 35CR, 70CR, 77CR, 147. NEPC PDX: 93, 145.1 and 145.2. NEPC cell line: NCI-H660. Androgen-dependent PCa cell line: LNCaP. b,c, RNA-seq data of HOXB genes (b) and AR (c) in the indicated models. RNA-seq data for NCI-H660 were generated in-house, and RNA-seq data for the rest models were obtained from GSE126078. RNA-seq was performed in triplicate for 35CR and NCI-H660, and in duplicate for the other models. d,e, Hi-C contact maps (5 kb resolution) of ASCL1 (d) and INSM1(e) locus in CRPC (top row) and NEPC (bottom row) models. Gene boxes and 1D ChIP–seq tracks of matched models are aligned at the bottom. Blue arrows indicate NEPC-enriched loops. The scale bars indicate ICE-normalized contact frequency. f,g, RNA-seq data of ASCL1 (f) and INSM1 (g) in the indicated models. The data source is the same as in b,c. Source data
Extended Data Fig. 2
Extended Data Fig. 2. Remarkable 3D chromatin reorganization during NE transformation of isogenic PCa cells.
a, Representative brightfield images showing the morphology of FOXA2-OE cells at days 7, 14, 21 and 28. LNCaP cells were infected with control (plv) or FOXA2 virus and followed up for 28 days. Cells were imaged every week. Scale bar: 100 μm. b, FOXA2 OE induced NET in 22Rv1 (left) and DU145 (right) cells. 22Rv1 or DU145 cells were infected with control (plv) or FOXA2 virus, and 22Rv1 cells were collected for WB analysis at week 4, whereas DU145 cells were collected at day 7. The data shown for 22Rv1 are from one of two independent experiments (n = 2), and those for DU145 are from one of three independent experiments (n = 3). c, LNCaP cells were co-infected with sgRB1&TP53 virus along with either sgNC or sgFOXA2 virus for 4 weeks before WB. The data shown are from one of two independent experiments (n = 2). d, Tumor growth curve of control (plv, n = 4 mice) and FOXA2-OE (n = 6 mice) LNCaP xenograft tumors. Data are mean ± s.d., and p value by two-sided t test. e, Hematoxylin and Eosin (H&E) of control (plv) and FOXA2-OE LNCaP xenograft tumors. Representative H&E images (×4) of FOXA2-OE tumors (n = 4) are shown on the left. The circled region indicates the tumor region with small-cell carcinoma-like features, and the high magnification images of small-cell carcinoma and adenocarcinoma tumors (×40) are shown in the middle. Scale bar, 30 µm. The percentage of small-cell carcinoma and adenocarcinoma tumors in the control and FOXA2-OE groups is quantified on the right. f, IHC of FOXA2 and SYP proteins in control (plv) and FOXA2-OE LNCaP xenograft tumors. Representative IHC images of FOXA2+/SYP+ and FOXA2+/SYP tumors in the FOXA2-OE group (n = 4) are shown on the left, and the quantification of them is shown on the right. Scale bar, 30 µm. Insets are shown at higher magnification. g, Unsupervised hierarchical clustering of time-course LNCaP+FOXA2 samples, CRPC and NEPC (in red font) based on the top 25% most variable PC1 of Hi-C matrices. Source data
Extended Data Fig. 3
Extended Data Fig. 3. Single-cell multiome analyses identified transitioning individual cells with intermediate transcriptome and chromatin states.
a, PCA analyses of chromatin accessibility of LNCaP+FOXA2 cells, along with LuCaP PDX, Merkel cell carcinoma (MCC) and NEPC cell lines (NCI-H660 and EF1-CFCE) using differentially accessible peaks (n = 368,330) identified by DESeq2 (adjusted p < 0.05). Adjusted p values were calculated by a likelihood ratio test with Benjamini–Hochberg correction. b, Genome browser views of ATAC–seq signal at NE lineage genes (POU3F2 and NCAM1, top row) and luminal lineage genes (KLK3 and HOXB13, bottom row) in time-course LNCaP+FOXA2 cells. c, TF motifs were plotted by ranks generated from their associated differential p values at ATAC–seq peaks in D2 and D28 LNCaP+FOXA2 samples. P values by two-sided hypergeometric test with Benjamini–Hochberg correction. d, UMAP integration of D0, D14 and D21 LNCaP+FOXA2 cells with previously published clinical PCa cells. e, Pseudotime trajectories in PCa cells shown in d. Color reflects pseudotime distance (primary PCa located at time = 0). f, UMAP visualization of AR and AR target genes (KLK3, NKX3-1) and NE lineage genes (SYP, NCAM1, POU3F2) in D0, D14 and D21 LNCaP+FOXA2 scRNA-seq samples. Color bars: normalized expression.
Extended Data Fig. 4
Extended Data Fig. 4. Clonality analyses of single LNCaP+FOXA2 cells support a mixed model of clonal transformation and expansion during NET.
a, Heatmap showing two clones delineated by single-cell CNV profiles inferred from scRNA-seq data by CopyKAT in FOXA2-driven NET model. Columns are gene windows ordered by genomic positions, while rows are individual cells that have been clustered using hierarchical clustering. Red color in the heatmap indicates amplification, and blue color indicates deletion. Color bar indicates log copy number ratios of each segment. b, scRNA-seq UMAP visualization of D0, D14 and D21 LNCaP+FOXA2 cells indicating clone 1 and clone 2 D0, D14 and D21 LNCaP+FOXA2 cells. c, Violin plots showing AR and NE signature scores of clone 1 and clone 2 in D0, D14 and D21 LNCaP+FOXA2 scRNA-seq samples. d, Heatmap showing two clones separated by SNVs (n = 1,093) inferred from scNanoRNA-seq data of D0 and D28 LNCaP+FOXA2 cells, clustered by k-means. Each row is one SNV, and each column is a cell. Variant allele frequency (VAF) is calculated as alternate allele read counts divided by all read counts for that nucleotide such as red represents mutant and blue for WT. e, UMAP visualization of scNanoRNA-seq data of D0 and D28 LNCaP+FOXA2 cells and their clonality. f, UMAP visualization of scNanoRNA-seq data of D0 and D28 LNCaP+FOXA2 cells and their expression of AR and NE signature genes. g, Violin plots showing AR and NE signature scores of clone 1 and clone 2 in D0 and D28 LNCaP+FOXA2 cells based on scNanoRNA-seq data. h, Heatmap showing germline mutations in D0 and/or D28 LNCaP+FOXA2 cells based on scNanoRNA-seq data. Each row represents one germline mutation, and each column is a cell. WT represents SNVs with supporting reads for the wildtype allele only, MUT are those that have at least 1 supporting read for the alternative allele and NA are those with 0 read coverage. Germline mutations were separately identified for each time point, with their mutation status plotted across the other time point without pre-filtering, wherein they might have 0 (showing as NA) or insufficient read coverage to capture the mutant allele (appearing as WT). Violin plots in c and g show median values (black line), interquartile range (IQR, black box) and the range of all data points within 1.5× IQR (whiskers). Source data
Extended Data Fig. 5
Extended Data Fig. 5. NKX2-1 is induced by FOXA2 and required for FOXA2-driven NET.
a, RT–PCR analysis of NKX2-1 mRNA in time-course LNCaP+FOXA2 cells and LuNE cells. Data were normalized to GAPDH. Shown are the mean ± s.e.m. of technical replicates from one of three (n = 3) independent experiments. P values by two-sided t test. b, Genome browser view of FOXA2 ChIP–seq signal around the NKX2-1 gene in NEPC cells (NCI-H660, LuCaP145.2). c,d, Hi-C contact maps (5 kb resolution) of NKX2-1 gene region in time-course LNCaP+FOXA2 cells (c), NCI-H660 and LuCaP PDX (d). The mRNA expression of NKX2-1 in the indicated samples is shown on the bottom right. Gene boxes and 1D ChIP–seq tracks of matched models are aligned at the bottom. Black arrows indicate enhancer–promoter loops at NKX2-1 locus. Enhancers are highlighted in light blue, and promoters in light orange color. FOXA2, NKX2-1, H3K27ac, H3K4me1, H3K27me3 and CTCF tracks under the D0 contact map used their corresponding ChIP–seq performed in closely related D2 cells. All others were done in conditions exactly matched to Hi-C. The scale bars indicate ICE-normalized contact frequency. e, Heatmap showing active (H3K27ac) enhancer (H3K4me1) and promoter (H3K4me3) marks at NKX2-1-only, FOXA2-only and shared binding sites in NCI-H660 cells. Scale bar: enrichment intensity. f, Pie chart showing the genomic distribution of FOXA2-only, NKX2-1-only and shared binding sites identified in NCI-H660 cells. g, TF motifs that significantly enriched at NKX2-1-only, FOXA2-only binding sites in NCI-H660 (top) and LuCaP145.1 (bottom). P values by two-sided hypergeometric test with Benjamini–Hochberg correction. h, The number of chromatin loops anchored by FOXA2 and NKX2-1 in time-course LNCaP+FOXA2 Hi-C samples. Source data
Extended Data Fig. 6
Extended Data Fig. 6. NKX2-1 is highly expressed in NEPC tumors and critical for NET of PCa.
a, Positive correlation between NKX2-1 and FOXA2 mRNA levels in PCa datasets. Shown on x and y axis are z scores of log2(MAS5.0 signal intensity + 1). The linear regression line (blue) with its 95% confidence interval (gray) is shown. P value by two-sided t test without multiple comparisons. b, IGV views of H3K27ac (top) and DNA methylation (bottom, 5mC) at NKX2-1 locus in LuCaP PDX. The green boxes indicate CpG islands. c, Boxplots showing average CpG methylation level at CpG island (CpG:314) of NKX2-1 in CRPC and NEPC patient samples in ref. (top, CRPC, n = 18; NEPC, n = 10) and in Zhao (2020) (bottom, CRPC, n = 93; NEPC, n = 5) dataset. Shown on the y axis are average percentage of methylated CpG at CpG island: 314. Boxplots represent the median and interquartile range (IQR); whiskers indicate the smallest and largest non-outlier values. P value by two-sided t test without multiple comparisons. d, Genomic alteration of NKX2-1 in the published PCa dataset. The data presented here consists of combined samples from following five studies: MSK, Clin Cancer Res 2020; SU2C/PCF Dream Team, PNAS 2019; Multi-Institute, Nat Med 2016; SU2C/PCF Dream Team, Cell 2015; MCTP, Nature 2012.
Extended Data Fig. 7
Extended Data Fig. 7. NKX2-1 is regulated by ASCL1 in FOXA2-low NEPC.
a, The RNA-seq data of FOXA2, NKX2-1, ASCL1 and NEUROD1 in LuCaP NEPC PDX. NKX2-1 is expressed in both FOXA2-high (49, 145.1 and 145.2) and FOXA2-low (93 and 173.1) PDX. RNA-seq data were obtained from GSE126078. b, Positive correlation between NKX2-1 and ASCL1 mRNA levels in PCa dataset. Shown on x and y axes are z scores of log2(MAS5.0 signal intensity + 1). The linear regression line (blue) with its 95% confidence interval (gray) is shown. P value by two-sided t test without multiple comparisons. c, IGV showing ASCL1, active enhancer marker (H3K4me1 and H3K27ac), promoter marker (H3K4me3) at NKX2-1 locus in LuCaP93 PDX. ASCL1 strongly binds to promoter and enhancer regions of NKX2-1. d, ASCL1 knockdown decreased expression of NKX2-1 at both mRNA (left) and protein (right) levels in LuCaP93 organoids. RT–PCR data shown are the mean ± s.e.m. of technical replicates from one of three (n = 3) independent experiments. P values by unpaired two-sided t test. WB data shown are from one of two (n = 2) independent experiments. e, Heatmap showing NKX2-1, ASCL1 binding at NKX2-1-only, shared and ASCL1-only sites in LuCaP93 PDX. Scale bar: enrichment intensity. f, NKX2-1 knockdown reduced LuCaP93 organoids growth. The quantification of the average number of organoids per field (n = 7 fields) is shown. P values by two-sided t test. g, NKX2-1 OE alone was unable to induce NET in LNCaP cells. LNCaP cells were infected with FOXA2 or NKX2-1 virus, and cells were collected for RT–PCR (left) and WB (right) analyses at week 4. The data are shown as in d. Source data
Extended Data Fig. 8
Extended Data Fig. 8. FOXA2 induces regional DNA demethylation during NET of PCa.
a, The mA and mCpG profiling on single DNA molecules spanning FOXA2 peak center at 4 quartiles of FOXA2 peaks as in Fig. 6b in D2 LNCaP+FOXA2 cells. Aggregate curves (top) for each quartile were created with a 50-bp rolling window. Base density across the 2-kb region for each quartile is indicated in the one-dimensional heatmaps (bottom); the scale bars indicate the number of adenine bases and CG dinucleotides sequenced at each position relative to FOXA2 peaks center as in Fig. 6b. Color scales are shown as in Fig. 6a. b, GO analyses by MSigDB of the top 200 genes associated with hyper-DMRs (left) and hypo-DMRs (right) between D2 and D28 LNCaP+FOXA2 cells. Top enriched molecular concepts are shown on the y axis, while the x axis indicates enrichment significance in −log10(p value); p values were calculated by the one-sided hypergeometric test. c, PCA analyses of CRPC/NEPC PDX and patient samples using the top 200 genes as in b. d,e, Aggregated mCpG intensity plots showing the DNA methylation profiles of CRPC PDX (d) and NEPC PDX (e) at previously reported NE-CREs and Ad-CREs.
Extended Data Fig. 9
Extended Data Fig. 9. CCS1477 targets lineage-specific enhancers active in a particular cell.
a, Heatmap showing FOXA2, NKX2-1 and p300 co-occupation at NE (C3–C4) and shared enhancers (C1–C2) in LuNE cells. The luminal/NE enhancers (enhs) are identified in Fig. 3a. Color bar at the bottom indicates the scale of ChIP–seq enrichment intensity. b, Heatmap showing H3K27ac at luminal and NE enhancers were, respectively, inhibited by CCS1477 in LNCaP and LuNE cells. The luminal/NE enhancers (enhs) are identified as in a. Color bar is shown as in a. c, Super-enhancers (SEs) were identified using H3K27ac ChIP–seq in LuNE cells. Hockey-stick plot showing the normalized rank and signals of H3K27ac. Representative SE-associated lineage-specific TFs and oncogenic genes are highlighted in red. d, IGV showing H3K27ac enrichment at SE-associated HOXA gene cluster, HOXB gene cluster and NFIB gene locus in LuNE cells treated with DMSO or CCS1477. The blue horizontal lines on the top of the tracks mark SEs. e, SEs were identified in LNCaP cells and depicted as in c. Representative SE-associated lineage-specific TFs and oncogenic genes are highlighted in red. f, IGV showing H3K27ac status at SE-associated gene loci in LNCaP cells treated with DMSO or CCS1477. The blue horizontal lines on the top of the tracks mark SEs. g, WB confirming p300 and CBP KD in LuNE cells subjected to shCBP and/or shp300. The data shown are from one of two (n = 2) independent experiments. h, GO analysis of p300/CBP-induced genes in LuNE cells. GO analysis was performed by MSigDB. Top enriched molecular concepts are shown on the y axis, while the x axis indicates enrichment significance. −log10(p value) is shown, p values by one-sided hypergeometric test. i, GO analysis of FOXA2/NKX2-1-induced genes in LuNE cells, performed as in g. j, Heatmap showing that most of CCS1477-regulated genes (FC ≥ 2, adjusted p < 0.05) were similarly regulated by p300/CBP, NKX2-1 and FOXA2. Data shown are the log2(FC) of CCS1477 relative to DMSO, and of sgNKX2-1, sgFOXA2 or sgFOXA2+sgNKX2-1 relative to sgNC, and of shp300, shCBP or shp300+shCBP to shCtrl. Adjusted p values by Wald test with Benjamini–Hochberg correction. Source data
Extended Data Fig. 10
Extended Data Fig. 10. p300/CBP inhibition suppresses NEPC cell growth in vitro and in vivo.
a, Colony formation assay of LuNE cells with the indicated gene KD. b,c, Colony formation assay of LuNE (b), LNCaP (c) cells treated with the indicated concentration of CCS1477. d, WB analysis of markers for cell cycle arrest (p21) and apoptosis (cleaved PARP and cleaved caspase 3) in LNCaP and LuNE cells treated with 500 nM CCS1477 for 24 h. Cycloheximide (CHX, 100 μg ml−1, 24 h)-treated cells were used as a control for cytotoxic effects. The data shown are from one of two (n = 2) independent experiments. e, Colony formation assay of benign prostatic hyperplasia BPH-1 and normal prostate epithelial RWPE-1 treated with the indicated concentration of CCS1477. f, Growth of LuCaP145.2 organoids and NCI-H660 cells treated with increasing doses of CCS1477. g, Images of LuNE xenograft tumors treated with vehicle or CCS1477. h, Body weight of mice treated with vehicle or CCS1477 for 33 days. Data in each time point are mean ± s.d. Y axis shows the percentage of body weight change. i, Representative IHC images of H3K27ac, SOX2 and NKX2-1 in LuNE xenograft tumors treated with vehicle or CCS1477 (n = 5 tumors per group). Scale bar, 30 µm. Insets are shown at higher magnification (×40). j, WB analysis of LuNE cells treated with 500 nM CCS1477 up to 60 h. The data shown are from one of two (n = 2) independent experiments. k, Images of LuCaP145.2 xenograft tumors treated with vehicle or CCS1477. l, H&E (left) and IHC of AR and PSA proteins (right) in LuCaP77CR (as a CRPC control) and in LuCaP145.2 PDX tumors treated with vehicle or CCS1477. Representative H&E and IHC images (n = 5 tumors per group) are shown. Scale bar, 30 µm. Insets are shown at higher magnification (×40). Source data

References

    1. Abida, W. et al. Genomic correlates of clinical outcome in advanced prostate cancer. Proc. Natl Acad. Sci. USA116, 11428–11436 (2019). - PMC - PubMed
    1. Aggarwal, R. et al. Clinical and genomic characterization of treatment-emergent small-cell neuroendocrine prostate cancer: a multi-institutional prospective study. J. Clin. Oncol.36, 2492–2503 (2018). - PMC - PubMed
    1. Beltran, H. et al. Divergent clonal evolution of castration-resistant neuroendocrine prostate cancer. Nat. Med.22, 298–305 (2016). - PMC - PubMed
    1. Conteduca, V. et al. Clinical features of neuroendocrine prostate cancer. Eur J. Cancer121, 7–18 (2019). - PMC - PubMed
    1. Ku, S. Y. et al. Rb1 and Trp53 cooperate to suppress prostate cancer lineage plasticity, metastasis, and antiandrogen resistance. Science355, 78–83 (2017). - PMC - PubMed

MeSH terms