. 2025 Jul 21;16(1):6706.
doi: 10.1038/s41467-025-61960-2.

Estimation-uncertainty affects decisions with and without learning opportunities

Affiliations

Estimation-uncertainty affects decisions with and without learning opportunities

Kristoffer C Aberg et al. Nat Commun. .

Abstract

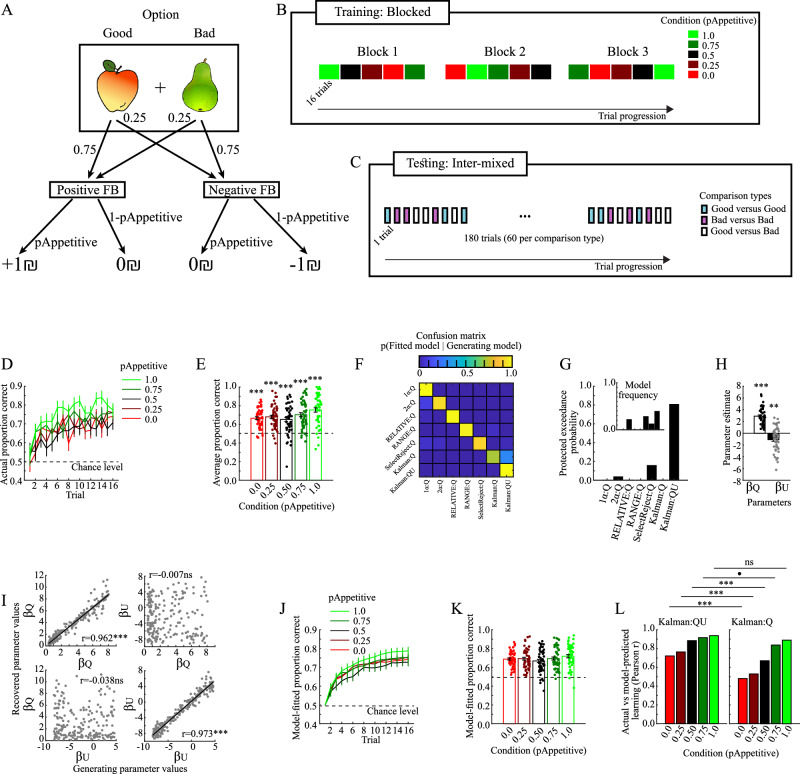
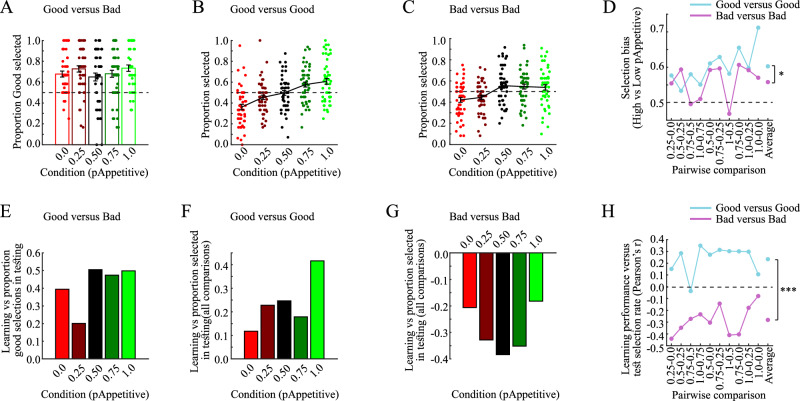
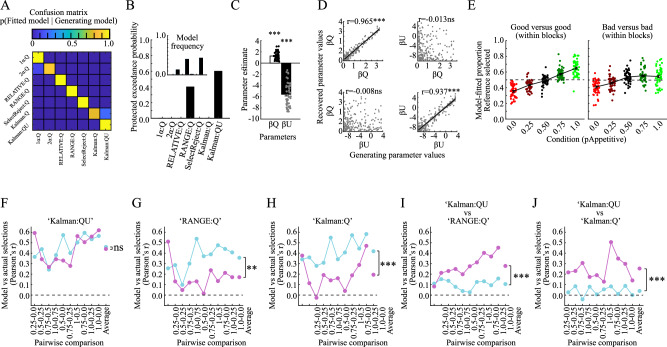
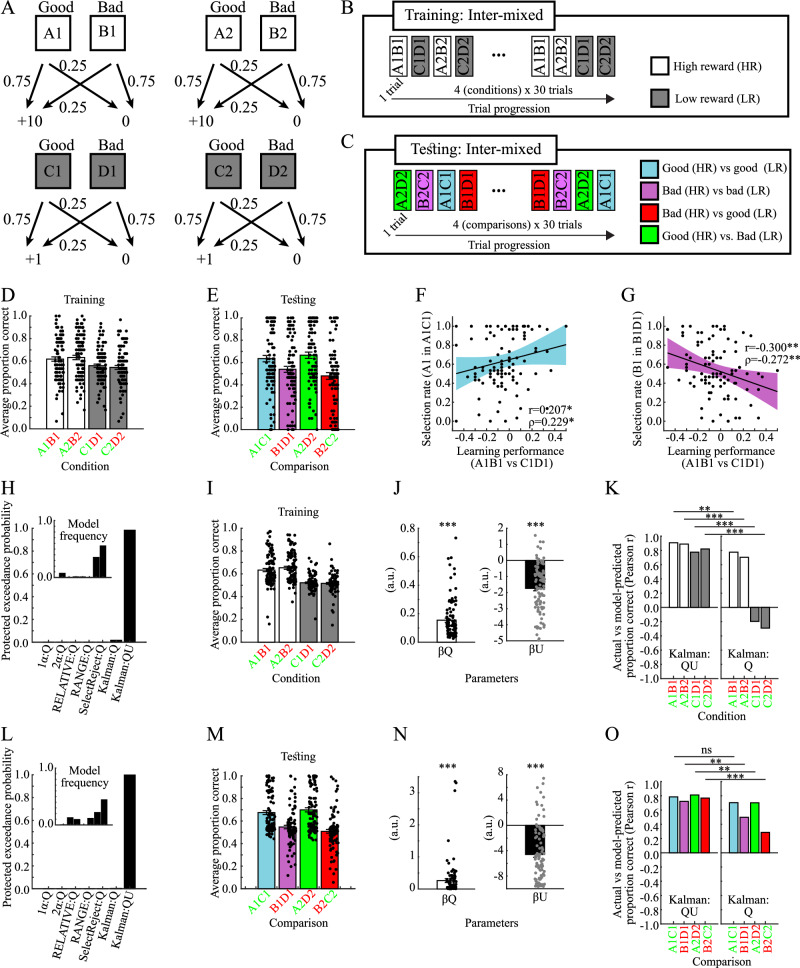
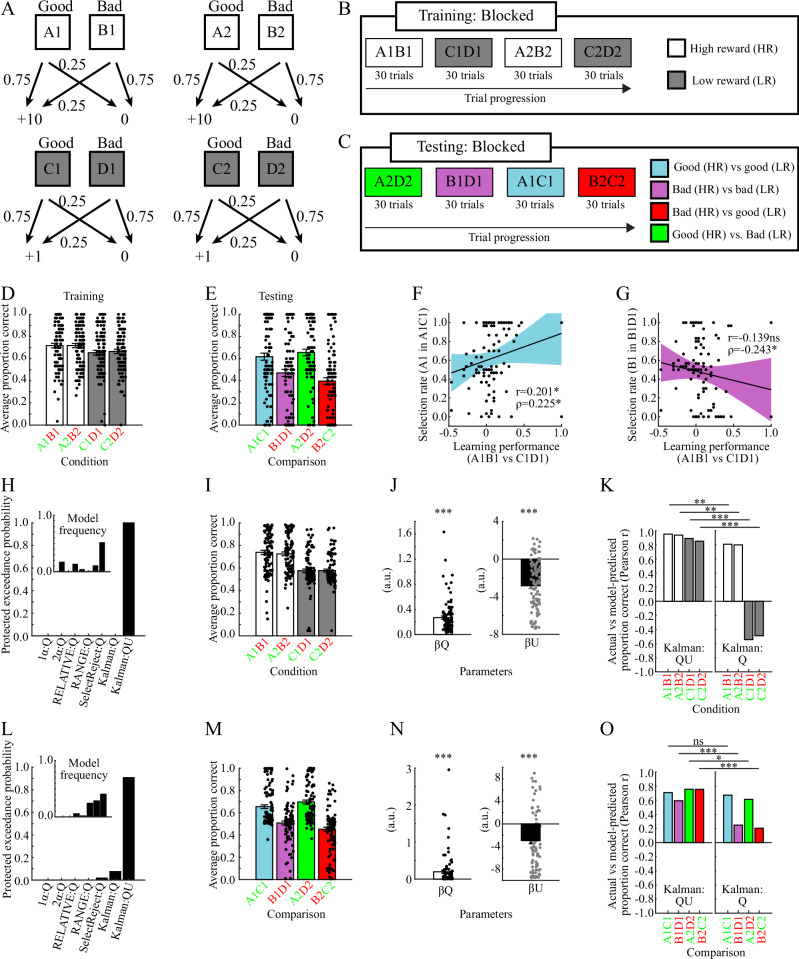
Motivated behavior during reinforcement learning is determined by outcome expectations and their estimation-uncertainty (how frequently an option has been sampled), with the latter modulating exploration rates. However, although differences in sampling-rates are inherent to most types of reinforcement learning paradigms that confront highly rewarded options with less rewarded ones, it is unclear whether and how estimation-uncertainty lingers to affect long-term decisions without opportunities to learn or to explore. Here, we show that sampling-rates acquired during a reinforcement learning phase (with feedback) correlate with decision biases in a subsequent test phase (without feedback), independently from outcome expectations. Further, computational model-fits to behavior are improved by estimation-uncertainty, and specifically so for options with smaller sampling-rates/larger estimation-uncertainties. These results are replicated in two additional independent datasets. Our findings highlight that estimation-uncertainty is an important factor to consider when trying to understand human decision making.


Conflict of interest statement

Competing interests: The authors declare no competing interests.

Figures

Fig. 1
Fig. 1. Learning phase (n = 50 samples, unless stated otherwise).
A Schematic of stimulus-outcome contingencies. Stimulus images from the Snoddgrass and Vanderwart ‘Like’ Objects dataset are released under a Creative Commons Attribution-NonCommercial-ShareAlike 3.0 Unported License by courtesy of Michel J. Tarr, Carnegie Mellon University http://tarrlab.org. B Schematic of trial progression during the learning phase. New objects were presented in each block, for a total of 15 different pairs of objects. C Schematic of trial progression during the test phase. D Actual learning curves. E Average actual learning performances (t(49)1.0 = 10.886, p < 0.001, 95%CI = [0.707 0.801], d = 1.537; t(49)0.75 = 9.422, p < 0.001, 95%CI = [0.660 0.746], d = 1.500; t(49)0.5 = 6.689, p < 0.001, 95%CI = [0.607 0.699], d = 0.946; t(49)0.25 = 10.578, p < 0.001, 95%CI = [0.646 0.715], d = 1.333; t(49)0.0 = 10.870, p < 0.001, 95%CI = [0.635 0.696], d = 1.540). F The confusion matrix obtained from the model-recovery procedure (n = 200 virtual participants). Denotation of a model’s learning part is separated from its decision part by the ‘:’ symbol, e.g., the Kalman:QU model learns using a Kalman-filter (Kalman) and decides based on expected values (Q) and estimation-uncertainties (U). G Protected exceedance probabilities and model-frequencies (inset) obtained from the model-fitting procedure. H Fitted values of the model-parameters for the winning Kalman:QU model (t(49)βQ = 14.399, p < 0.001, 95%CI = [2.510 3.324], Cohen’s d = 2.036; t(49)βU = 3.790, p < 0.001, 95%CI = [−1.653 −0.507], Cohen’s d = 0.536). I Pearson’s correlation coefficients between the values of generating model-parameters and their recovered values obtained via the parameter-recovery procedure (n = 200 virtual participants; rβQ-βQ = 0.962, p < 0.001; rβU-βU = 0.973, p < 0.001; rβQ-βU = 0.007, p = 0.919; rβU-βU = −0.038, p = 0.598). J Model-fitted learning curves. K. Average model-derived learning performances. L Pearson’s correlation coefficients between actual and model-fitted performances in each condition for the Kalman:QU model (left panel) and the Kalman:Q model (right panel). Δr0 = 0.240, pPermutation < 0.001, 95%CIPermutation [−0.082 0.080], SES = 2.859; Δr0.25.25 = 0.234, pPermutation = 0.003, 95%CIPermutation [−0.092 0.093], SES = 3.083; Δr0.50 = 0.214, pPermutation = 0.002, 95%CIPermutation [−0.139 0.135], SES = 3.004; Δr0.75 = 0.079, pPermutation = 0.083, 95%CIPermutation [−0.157 0.144], SES = 1.755; Δr1.0 = 0.047, pPermutation = 0.276, 95%CIPermutation [−0.174 0.155], SES = 1.092. All tests are two-tailed and uncorrected p values are reported. All errorbars indicate the standard error of the mean, and the shaded areas of Figure I indicate 95% confidence interval. d=Cohen’s d. SES=Standardized effect size. pPermutation and 95%CIPermutation is the p-value and confidence interval for the null-distribution obtained via permutation testing. ***p < 0.001, **p < 0.01, *p < 0.05, •p < 0.10, ns not significant.
Fig. 2
Fig. 2. Test phase behavior (n = 50, unless stated otherwise).
A Above-chance selection rates of the Good option in Good versus Bad pairs indicate that participants successfully transferred learned information to the test phase. These comparisons contrast Good and Bad options from one condition learned in different blocks. B Selection rates of options from different conditions in Good versus Good pairs. These comparisons contrast Good options from different conditions, learned in the same block. C Selection rates of options from different conditions in Bad versus Bad pairs. These comparisons contrast Bad options from different conditions, learned in the same block. D Selection bias towards more valuable options in pairwise comparisons. These results indicate that options with higher expected values in the learning phase were more likely to be selected in the test phase, in particular for Good versus Good pairs (ANOVA, main effect: F(1, 49) = 4.36, p = 0.042, ηp2 = 0.082). E Pearson’s correlation coefficients between learning performance and the selection rate of Good options in Good versus Bad pairs. Participants with higher learning performance were more likely to select the Good option. F Pearson’s correlation coefficients between learning performance and the selection of Good options in Good versus Good pairs. Participants with higher learning performance in a condition were more likely to select Good options from that condition. G Pearson’s correlation coefficients between learning performance and the selection of Bad options in Bad versus Bad pairs. Participants with higher learning performance in a condition were less likely to select Bad options from that condition. H Pairwise correlations (Pearson) between the difference in learning performance and selection rates in the test phase. Differences in learning performance correlated positively with differential selection rates in Good vs Good pairs (blue line), but negatively with the difference in selection rates in Bad vs Bad pairs (pink line), with a significant difference between these two pair types (ANOVA, main effect: F(1, 2839) = 112.4, p < 0.001). Please observe that the learning performance is exactly related to the sampling-rate of Good options, but inversely so (1-learning performance) for Bad options. ηp2=Partial eta squared. ***p < 0.001, *p < 0.05.
Fig. 3
Fig. 3. Test phase modeling (n = 50, unless stated otherwise).
A Confusion matrix obtained from the model-recovery procedure. B Protected exceedance probabilities and model frequencies (inset). C Fitted values for the model-parameters of the Kalman:QU model (t(49)βQ = 11.979, p < 0.001, 95%CI = [1.020 1.430], d = 1.721; t(49)βU = 18.566, p < 0.001, 95%CI = [−6.083 4.896], d = 2.689). D Pearson’s correlation coefficients between the values of generating model-parameters and their recovered values (rβQ-βQ = 0.965, p < 0.001; rβU-βU = 0.937, p < 0.001; rβQ-βU = −0.013, p = 0.855; rβU-βU = −0.008, p = 0.909). E Model-predicted selection rates of options from different conditions in Good versus Good (left panel) and Bad versus Bad pairs (right panel). F Correlations (Pearson) between actual and model-fitted performances in each pairwise comparison for the Kalman:QU model. There is no significant difference in correlations between Good versus Good (blue line) and Bad versus Bad pairs (pink line; ANOVA main effect F(1, 979) = 0.12, p = 0.728). G Correlations (Pearson) between actual and model-fitted performances in each pairwise comparison for the RANGE:Q model show a difference in correlations between Good versus Good (blue line) and Bad versus Bad pairs (pink line; ANOVA main effect F(1, 979) = 105.4, p < 0.001). H Correlations (Pearson) between actual and model-fitted performances in each pairwise comparison for the Kalman:Q model show a difference in correlations between Good versus Good (blue line) and Bad versus Bad pairs (pink line; ANOVA main effect F(1, 979) = 15.22, p < 0.001). I Differential correlations (Pearson) between actual and model-fitted performances in each pairwise comparison for the Kalman:QU versus the RANGE:Q model. The Kalman:QU model provides a better fit for Bad versus Bad pairs (pink line; t(49) = 5.197, p < 0.001, 95%CI = [0.098 0.249], d = 1.643). J Differential correlations (Pearson) between actual and model-fitted performances in each pairwise comparison for the Kalman:QU versus the Kalman:Q model. The Kalman:QU model provides a better fit for Bad versus Bad pairs (pink line; t(49) = 5.813, p < 0.001, 95%CI = [0.131 0.297], d = 1.838). All reported tests are two-tailed and uncorrected p values are reported. All errorbars indicate the standard error of the mean, and the shaded areas of D indicate 95% confidence interval. All errorbars indicate the standard error of the mean. d=Cohen’s d. ***p < 0.001, **p < 0.01, *p < 0.05, ns not significant.
Fig. 4
Fig. 4. Validation 1 (n = 100).
A Schematic of stimulus-outcome contingencies B Schematic of trial progression during the learning phase. C Schematic of trial progression during the test phase. D Average actual learning performance. E Average actual test performance. F Positive correlation between differences in learning performance and selection biases in the test phase for Good versus Good pairs (r = 0.207, p = 0.039; ρ = 0.229, p = 0.022). G Negative correlation between differences in learning performance and selection biases in the test phase for Bad versus Bad pairs (r = −0.300, p = 0.003; ρ = −0.272, p = 0.006). Please observe that the learning performance is inversely related to the sampling-rate of Bad options (i.e., sampling-rate of Bad options = 1-learning performance). H Protected exceedance probabilities and model frequencies (inset) for the learning phase. I Average model-fitted learning performance. J Fitted values for the model-parameters of the Kalman:QU model (t(49)βQ = 10.938, p < 0.001, 95%CI = [0.126 0.182], d = 1.094; t(49)βU = 11.699, p < 0.001, 95%CI = [−2.072 −1.471], d = 1.170). K Correlations between actual and model-fitted learning performance in each condition for the Kalman:QU (left panel) and the Kalman:Q model (right panel). The Kalman:QU model provides a better fit in all conditions: ΔrA1B1 = 0.131, pPermutation = 0.002, 95%CIPermutation [−0.084 0.081], SES = 3.009; ΔrA2B2 = 0.186, pPermutation < 0.001, 95%CIPermutation [−0.086 0.088], SES = 4.103; ΔrC1D1 = 0.972, pPermutation < 0.001, 95%CIPermutation [−0.310 0.329], SES = 5.987; ΔrC2D2 = 1.112, pPermutation < 0.001, 95%CIPermutation [-0.318 0.297], SES = 6.987. L Protected exceedance probabilities and model frequencies (inset) for the test phase. M Average model-fitted test performance. N Fitted values for the model-parameters of the Kalman:QU model (t(49)βQ = 4.402, p < 0.001, 95%CI = [0.141 0.371], d = 0.440; t(49)βU = 10.770, p < 0.001, 95%CI = [−5.561 −3.831], d = 1.077). O Correlations between actual and model-fitted performance in each comparison for the Kalman:QU (left panel) and the Kalman:Q model (right panel). The Kalman:QU model provides a better fit in all conditions including Bad options, but not the condition which includes two Good options (A1C1; blue bar; ΔrA1C1 = 0.081, pPermutation = 0.120, 95%CIPermutation [−0.088 0.087], SES = 1.338; ΔrB1D1 = 0.223, pPermutation = 0.002, 95%CIPermutation [−0.141 0.148], SES = 2.962; ΔrA2D2 = 0.110, pPermutation = 0.006, 95%CIPermutation [-0.078 0.078], SES = 2.762; ΔrB2C2 = 0.482, pPermutation < 0.001, 95%CIPermutation [−0.201 0.197], SES = 4.742). All errorbars indicate the standard error of the mean. d=Cohen’s d. SES=Standardized effect size. pPermutation and 95%CIPermutation is the p-value and confidence interval for the null-distribution obtained via permutation testing. ***p < 0.001, **p < 0.01, *p < 0.05, ns not significant.
Fig. 5
Fig. 5. Validation 2 (n = 100).
A Schematic of stimulus-outcome contingencies B Schematic of trial progression during the learning phase. C Schematic of trial progression during the test phase. D Average actual learning performance. E Average actual test performance. F Positive correlation (Pearson, Spearman) between differences in learning performance and selection biases in the test phase for Good versus good pairs (r = 0.201, p = 0.045; ρ = 0.225, p = 0.025). G Negative correlation (Pearson, Spearman) between differences in learning performance and selection biases in the test phase for Bad versus Bad pairs (r = −0.139, p = 0.167; ρ = 0.243, p = 0.015). Please observe that the learning performance is inversely related to the sampling-rate of Bad options (i.e., sampling-rate of Bad options = 1-learning performance). H Protected exceedance probabilities and model frequencies (inset) for the learning phase. I Average model-fitted learning performance. J Fitted values for the model-parameters of the Kalman:QU model (t(49)βQ = 10.402, p < 0.001, 95%CI = [0.215 0.317], d = 1.040; t(49)βU = 10.404, p < 0.001, 95%CI = [−3.300 −2.243], d = 1.040). K Correlations (Pearson) between actual and model-fitted learning performance in each condition for the Kalman:QU (left panel) and the Kalman:Q model (right panel). The Kalman:QU model provides a better fit in all conditions. ΔrA1B1 = 0.143, pPermutation = 0.005, 95%CIPermutation [−0.104 0.098], SES = 2.823; ΔrA2B2 = 0.138, pPermutation = 0.005, 95%CIPermutation [−0.100 0.087], SES = 2.782; ΔrC1D1 = 1.433, pPermutation < 0.001, 95%CIPermutation [−0.356 0.371], SES = 7.953; ΔrC2D2 = 1.340, pPermutation < 0.001, 95%CIPermutation [−0.345 0.352], SES = 7.351). L Protected exceedance probabilities and model frequencies (inset) for the test phase. M Average model-fitted test performance. N Fitted values for the model-parameters of the Kalman:QU model (t(49)βQ = 4.551, p < 0.001, 95%CI = [0.110 0.280], d = 0.455; t(49)βU = 6.194, p < 0.001, 95%CI = [−3.907 −2.011], d = 0.619). O Correlations (Pearson) between actual and model-fitted performance in each comparison for the Kalman:QU (left panel) and the Kalman:Q model (right panel). The Kalman:QU model provides a better fit in all conditions including Bad options, but not the condition which includes two Good options (A1C1; blue bar; ΔrA1C1 = 0.035, pPermutation = 0.338, 95%CIPermutation [−0.068 0.066], SES = 1.024; ΔrB1D1 = 0.345, pPermutation < 0.001, 95%CIPermutation [−0.197 0.193], SES = 3.493; ΔrA2D2 = 0.143, pPermutation = 0.010, 95%CIPermutation [−0.111 0.112], SES = 2.531; ΔrB2C2 = 0.550, pPermutation < 0.001, 95%CIPermutation [−0.245 0.234], SES = 4.492). All errorbars indicate the standard error of the mean. d=Cohen’s d. SES=Standardized effect size. pPermutation and 95%CIPermutation is the p-value and confidence interval for the null-distribution obtained via permutation testing. ***p < 0.001, **p < 0.01, *p < 0.05, ns not significant.

Similar articles

References

    1. Niv, Y. Reinforcement learning in the brain. J. Math. Psychol.53, 139–154 (2009).
    1. Seitz, A. & Watanabe, T. A unified model for perceptual learning. Trends Cognit. Sci.9, 329–334 (2005). - PubMed
    1. Doya, K. Complementary roles of basal ganglia and cerebellum in learning and motor control. Curr. Opin. Neurobiol.10, 732–739 (2000). - PubMed
    1. Kaelbling, L. P., Littman, M. L. & Moore, A. W. Reinforcement learning: a survey. J. Artif. Intell. Res.4, 237–285 (1996).
    1. Botvinick, M. et al. Reinforcement learning, fast and slow. Trends Cognit. Sci.23, 408–422 (2019). - PubMed

LinkOut - more resources