. 2025 Jul 22;10(1):233.
doi: 10.1038/s41392-025-02309-5.

Aberrant Notch-signaling promotes tumor angiogenesis in esophageal squamous-cell carcinoma

Affiliations

Aberrant Notch-signaling promotes tumor angiogenesis in esophageal squamous-cell carcinoma

Cainan Li et al. Signal Transduct Target Ther. .

Erratum in

Abstract

Esophageal squamous-cell carcinoma (ESCC) is one of the most common gastrointestinal cancers in China, characterized by high malignancy and poor prognosis. Nowadays, the therapeutic options for this cancer are very limited. Notch-signaling is often overactivated in ESCC, but its role remains to be fully elucidated. Here, we demonstrate that aberrant Notch-signaling plays an important role in tumor angiogenesis. In clinical ESCC samples, Notch-signaling activation scores were significantly correlated with tumor microvascular density, advanced TNM stages, and short patient survival time. Silencing Notch-signaling substantially suppressed the ability of ESCC cells to promote angiogenesis in vitro and in vivo. By integrating analysis of CUT&Tag and RNA sequencing data, we identified ubiquitin-specific protease 5 (USP5) as a Notch-signaling downstream effector that is transcriptionally upregulated by the NOTCH1 intracellular domain (NICD1)-RBPJ complex and mediates tumor angiogenesis. USP5 stabilized STAT3 via its deubiquitination function, thereby enhancing the production of pro-angiogenic factors by cancer cells, including VEGF, ANGPT2, and CXCL1. We showed that chemotherapy combined with the USP5 inhibitor can additionally repress tumor growth and angiogenesis in mice. These findings explain why ESCC cells have much fewer NOTCH1 mutations than normal and precancerous epithelium, reveal a novel mechanism for Notch-signaling to drive tumor angiogenesis via the NOTCH1-USP5-STAT3 axis, and open a potential new avenue for anti-tumor angiogenesis therapy.


Conflict of interest statement

Competing interests: The authors declare no competing interests.

Figures

Fig. 1
Fig. 1
Aberrant Notch-signaling activation promotes angiogenesis and correlates with poor prognosis in ESCC. a UMAP plot of 86,933 single cells from ESCC tumor tissues, illustrating the distribution of three distinct cell types, i.e., epithelial cells, endothelial cells and fibroblasts. b Pathway enrichment analysis of differentially expressed genes between Notch-signaling score high and Notch-signaling score low groups. c Gene set enrichment analysis between Notch-signaling score high and Notch-signaling score low groups shows significantly enriched angiogenesis in the Notch-signaling score high group. d Spearman correlations between the Notch-signaling scores and the angiogenesis scores in three different datasets. The shaded areas represent 95% confidence intervals. e, f Significant positive correlation between NICD1 and CD31 protein levels in tissue microarrays consisting of 312 ESCC samples. Panel (e) shows multiplexed immunofluorescence staining images and panel (f) shows Spearman correlation between NICD1 and CD31 levels, with the shaded area representing 95% confidence interval. Epithelial cells were stained with panCK, and nuclei were stained with DAPI. Scale bar, 300 μm. g Boxplot showing significantly different NICD1 immunofluorescence intensities in early ESCC (TNM stage I/II) or advanced ESCC (TNM stage III/IV). Data are median (central line) with the 25−75% interquartile range, and whiskers represent ±1.5 times the interquartile range. P value was derived from the Wilcoxon rank-sum test. h Kaplan–Meier survival analysis of 312 ESCC patients stratified by median NICD1 immunofluorescence (IF) intensity. P value was derived from the log-rank test. The hazard ratio (HR) and 95% confidence interval (CI) were calculated using a multivariate Cox proportional hazard model, adjusting for age, sex, tumor stage, smoking, and drinking status
Fig. 2
Fig. 2
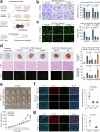
Aberrant Notch-signaling activation promotes tumor angiogenesis. a The schematics of in vitro and in vivo experiments to evaluate the effect of Notch signaling on angiogenesis. HUVEC, human umbilical vein endothelial cell. b The effect of the NOTCH1-knocked out ESCC cell culture medium on HUVEC migration. The left panel shows images of HUVECs in Transwell assays, and the right panel shows the quantitative statistics. Scale bar, 300 μm. c The effect of NOTCH1-knocked out ESCC cell culture medium on HUVEC tube formation. The left panel shows images of the tube density, and the right panel shows the quantitative statistics. Scale bar, 500 μm. d The effect of NOTCH1-knocked out or NICD1-overexpressed ESCC cell culture medium on hemoglobin (Hb) content and microvascular density in the Matrigel plug assays. The left panel shows Matrigel plug images and sections with H&E or CD31 staining, and the right panel shows the quantitative statistics. Scale bar, 50 μm. e NOTCH1 knockout substantially reduced the growth rate of mouse xenografts derived from human ESCC cells. The upper panel shows xenograft tumors derived from NOTCH1-knockout or NOTCH1-non-knockout ESCC cells at the end of the experiment, and the lower panel shows the different growth curves of xenografts in mice during the experiment. f NOTCH1-knockout ESCC cell-derived xenografts had significantly reduced microvascular density compared with NOTCH1-non-knockout ESCC cell-derived xenografts. The left panel shows representative immunofluorescence images of NICD1 and CD31, and the right panel shows quantitative statistics. The ESCC xenograft tumor tissues were identified by panCK staining. Scale bar, 50 μm. g NICD1 and CD31 in 4-NQO-induced ESCC in Notch1+/+ or Notch1−/− mice. The left panel shows immunofluorescence staining images of NICD1 and CD31, and the right panel shows the quantitative statistics. The 4-NQO-induced ESCC was identified by panCK staining. Scale bar, 50 μm. Data are mean ± SEM from 5 (b) and 3 (c) independent experiments, and each had 3 replicates, or 3 (d) and 5 (eg) mice. P values were derived from Student’s t-test
Fig. 3
Fig. 3
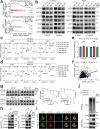
NICD1–RBPJ complex regulates USP5 transcriptional expression. a Pie plot showing the genomic distribution of NICD1 CUT&Tag peaks in KYSE30 cells. b NICD1 CUT&Tag signal height and position relative to the TSS for all genes in KYSE30 cells. c CUT&Tag density heatmap of NICD1 enrichment within 3 kb around TSS in KYSE30 cells. d Venn diagram showing the intersection results of NICD1 binding sites and protein-coding genes that had decreased mRNA levels due to NOTCH1 knockout. e IGV tracks for USP5 from NICD1 CUT&Tag analysis, showing NICD1 is enriched in the USP5 promoter region. f NOTCH1-knockout cells had significantly reduced USP5 RNA levels compared with control cells. USP5 RNA levels were determined by qRT-PCR and normalized by GAPDH RNA levels. Data are mean ± SEM from three biological replicates. g Western blot analysis shows substantially decreased USP5 levels in NOTCH1-knockout ESCC cells compared with control cells. The experiment had three biological replicates. h NOTCH1-knockout ESCC cell-derived mouse xenografts had significantly reduced NICD1 and USP5 protein levels compared to control ESCC cell-derived xenografts. The left panel shows representative NICD1 and USP5 immunofluorescence staining images in tumor sections, and the right panel shows the quantitative statistics. Scale bar, 50 μm. Data are mean ± SEM from 5 mice. i In silico analysis indicates a potential RBPJ-binding site in the USP5 promoter region. j Chromatin immunoprecipitation with anti-NICD1 or anti-RBPJ antibody-coupled qPCR assays demonstrates the binding of NICD1/RBPJ to the USP5 promoter region in KYSE30 cells. Data are mean ± SEM from three independent experiments. k The results of reporter gene assays with plasmid constructs consisting of wild-type (WT) or mutant-type (MUT) USP5 promoter in NOTCH1-knocked out or NOTCH1-nonknocked out KYSE30 cells. Data are mean ± SEM from 3 independent experiments. P values in this figure were derived from Student’s t-test
Fig. 4
Fig. 4
Elevated USP5 mediates Notch-signaling activation-induced tumor angiogenesis. a Ectopic overexpression of USP5 in NOTCH1-knocked out ESCC cells can rescue the ability of ESCC cells to promote HUVEC migration. The left panel shows the Transwell assay images, and the right panel is the quantitative statistics. Scale bar, 300 μm. b Ectopic overexpression of USP5 in NOTCH1-knocked out ESCC cells can rescue the ability of ESCC cells to promote HUVEC tube formation. The left panel shows the HUVEC tube density, and the right panel shows the quantitative statistics. Scale bar, 500 μm. c Ectopic overexpression of USP5 in NOTCH1-knocked out ESCC cells can rescue the ability of ESCC cells to increase the hemoglobin (Hb) content and microvascular density in vivo in Matrigel plug assays. The upper panel shows Matrigel plug images and H&E or CD31 staining of their sections. The lower panel is the quantitative statistics. Scale bar, 50 μm. d Ectopic overexpression of USP5 in NOTCH1-knocked out ESCC cells can restore the faster growth of ESCC cells-derived xenografts in mice. The left panel shows the xenograft growth curves during the experiment, and the right panel shows ESCC xenografts at the end of the experiment. e, f Ectopic overexpression of USP5 in NOTCH1-knocked out ESCC cells can rescue the microvascular density in xenografts. Panel (e) shows the quantitative statistics, and panel (f) shows the images of NICD1, USP5 and CD31 immunofluorescence staining. The ESCC xenograft tumor tissues were identified by panCK staining. Scale bar, 50 μm. g A possible molecular mechanism for Notch-signaling to regulate angiogenesis in ESCC: via activating USP5 transcription. Data are mean ± SEM from 5 (a) and 3 (b) independent experiments and each had three replicates, or 3 (c) and 5 (d, e) mice. P values were derived from Student’s t-test. ns not significant
Fig. 5
Fig. 5
USP5 deubiquitinates STAT3 to increase the production of pro-angiogenic factors. a Gene set enrichment analysis revealed significant enrichment of the JAK-STAT signaling pathway in samples with high Notch-signaling score or USP5 level compared with those with low Notch-signaling score or USP5 level. The upper panel shows results from the analysis of our previously published single-cell RNA sequencing data of 60 ESCC samples based on the Notch-signaling score, and the lower panel shows results from the analysis of a published proteomics data based on the USP5 level. b Western blot analysis shows substantially reduced STAT3, pSTAT3, ANGPT2, VEGF and CXCL1 in NOTCH1- or USP5-knocked out ESCC cells compared with control cells. The experiment had 3 biological replicates. c, d Enzyme-linked immunosorbent assays show substantially reduced VEGF, ANGPT2 and CXCL1 levels in the culture medium of NOTCH1- or USP5-knocked out cells compared with control cells. Data are mean ± SEM from 3 independent measurements. e The effects of NOTCH1 or USP5 knockout on STAT3 transcription in ESCC cells. STAT3 RNA levels were determined by qRT-PCR and normalized by GAPDH RNA levels. Data are mean ± SEM from 3 biological replicates. f Spearman correlation analysis of the proteomics data shows a significant and positive correlation between the USP5 levels and STAT3 levels. Shade represents a 95% confidence interval. g The effects of NICD1 or USP5 overexpression on the STAT3 protein stability in KYSE450 cells in the presence of 50 μg/mL CHX. The left panel shows Western blot analysis of STAT3 protein levels as a function of different CHX treatment time points, and the right panel shows the quantitative statistics. Data are mean ± SEM from three independent measurements. h Immunoblot (IB) analysis of the reciprocal coimmunoprecipitation (IP) products with USP5 or STAT3 antibody revealed the interaction of USP5 with STAT3 in KYSE30 cells. i Multiplexed immunofluorescence staining and confocal analysis show co-localization of USP5 and STAT3 in ESCC cells. The nuclei were stained with DAPI. Scale bar, 10 μm. j STAT3 is deubiquitinated by USP5. Shown is Western blot analysis of cellular lysates from Flag-labeled STAT3 and MYC-labeled ubiquitin transfected KYSE30 cells with or without HA-labeled USP5, followed by treatment with 20 μM MG132 for 6 h. Input was used as control, and the experiment had 3 biological replicates. P values in this figure were derived from Student’s t-test. ns not significant
Fig. 6
Fig. 6
USP5 is a promising therapy target for ESCC. a Schematics of USP5 inhibitor EOAI3402143 therapy in NSG mouse ESCC xenograft models. Mice were subcutaneously implanted with NICD1-overexpressed KYSE450 cells or their control counterparts and, 7 days later, treated (i.p., daily) with EOAI3402143 or vehicle for 21 days. b NICD1 overexpression significantly promoted, but EOAI3402143 treatment significantly suppressed the growth rates of mouse ESCC xenografts. The left panel shows growth curves of xenografts with different treatments, and the right panel shows tumors obtained from mice at the end of the experiment (day 30). Data are mean ± SEM from 5 or 6 mice. c Multiplexed immunofluorescence staining analysis of NICD1 and CD31 levels in xenografts with different treatments. The left panel shows immunofluorescence staining images, and the right panel shows quantitative statistics. The ESCC xenograft tumor was identified by panCK staining. Scale bar, 50 μm. Data are mean ± SEM from 5 or 6 mice. d Schematics of USP5 inhibitor EOAI3402143 combined with 5-FU/CDDP therapy in NSG mouse ESCC xenograft models. Mice were subcutaneously implanted with KYSE30 cells, and 7 days later, treated with EOAI3402143 or 5-FU/CDDP, or their combination. e EOAI3402143 treatment, especially in combination with 5-FU/CDDP, significantly suppressed the growth of mouse ESCC xenografts. The left panel shows growth curves of xenografts with different treatments, and the right panel shows tumors obtained from mice at the end of the experiment (day 30). Data are mean ± SEM from 4 mice. f Multiplexed immunofluorescence staining analysis of CD31 levels in xenografts with different treatments. The left panel shows H&E and immunofluorescence staining images, and the right panel shows quantitative statistics. The ESCC xenograft tumor was identified by panCK staining. Scale bar, 50 μm. Data are mean ± SEM from 4 mice. P values in this figure were derived from Student’s t-test. ns not significant
Fig. 7
Fig. 7
Schematics of the proposed role of Notch-signaling activation in enhancing tumor angiogenesis in ESCC. The aberrantly high Notch signaling transcriptionally activates the USP5 gene to produce USP5, which deubiquitinates STAT3 to prevent STAT3 from ubiquitination and degradation. The increased STAT3 activity enhances the production of its downstream pro-angiogenic factors such as VEGF, ANGPT2, and CXCL1, resulting in angiogenesis in ESCC. Thus, the NOTCH1–USP5–STAT3 axis might be a therapeutic target for ESCC

References

    1. Siegel, R. L., Giaquinto, A. N. & Jemal, A. Cancer statistics, 2024. CA Cancer J. Clin.74, 12–49 (2024). - PubMed
    1. Abnet, C. C., Arnold, M. & Wei, W. Epidemiology of esophageal squamous cell carcinoma. Gastroenterology154, 360–373 (2018). - PMC - PubMed
    1. Smyth, E. C. et al. Oesophageal cancer. Nat. Rev. Dis. Prim.3, 1–21 (2017). - PMC - PubMed
    1. Yang, X. et al. Collagen 1-mediated CXCL1 secretion in tumor cells activates fibroblasts to promote radioresistance of esophageal cancer. Cell Rep.42, 113270 (2023). - PubMed
    1. Chen, X. et al. Alarmin S100A8 imparts chemoresistance of esophageal cancer by reprogramming cancer-associated fibroblasts. Cell Rep. Med.5, 101576 (2024). - PMC - PubMed

MeSH terms