. 2025 Jul 21;16(1):6692.
doi: 10.1038/s41467-025-62032-1.

A longitudinal cohort study uncovers plasma protein biomarkers predating clinical onset and treatment response of rheumatoid arthritis

Affiliations

A longitudinal cohort study uncovers plasma protein biomarkers predating clinical onset and treatment response of rheumatoid arthritis

Siyu He et al. Nat Commun. .

Abstract

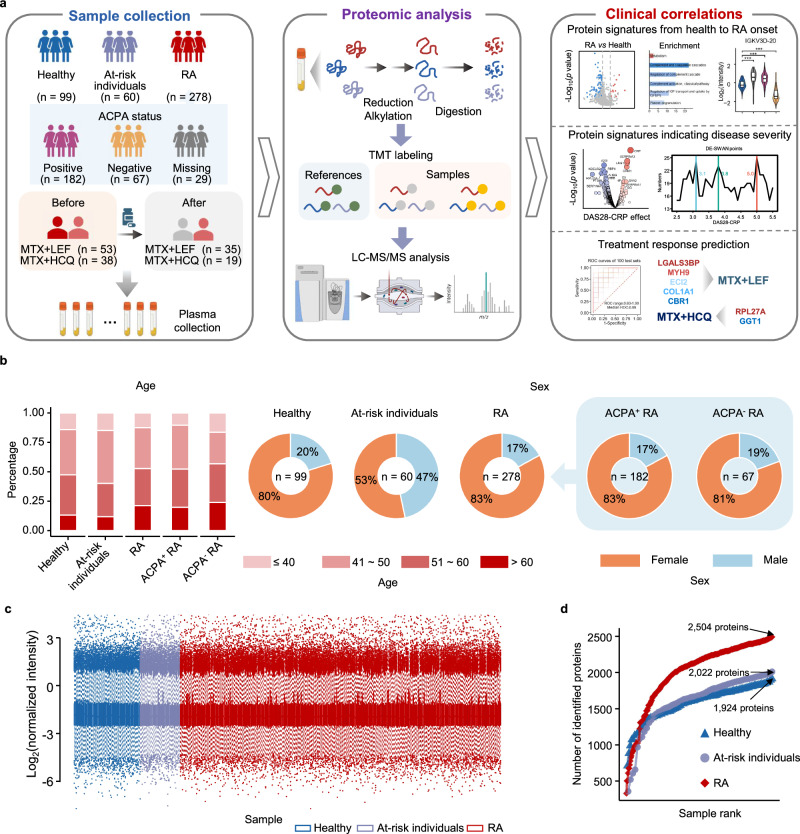
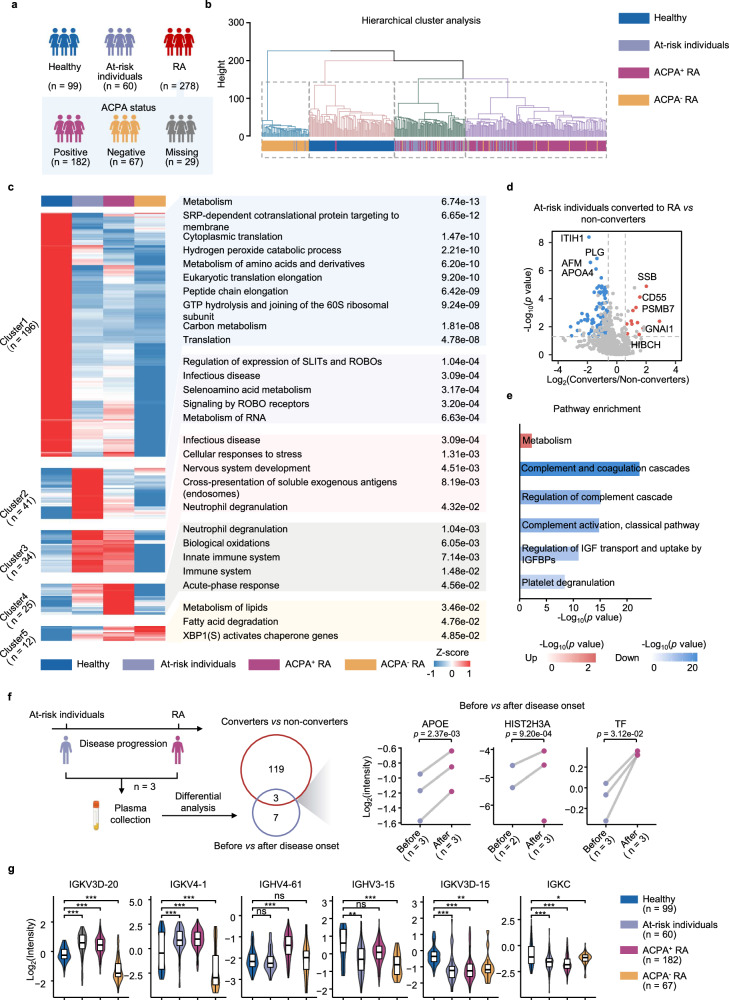
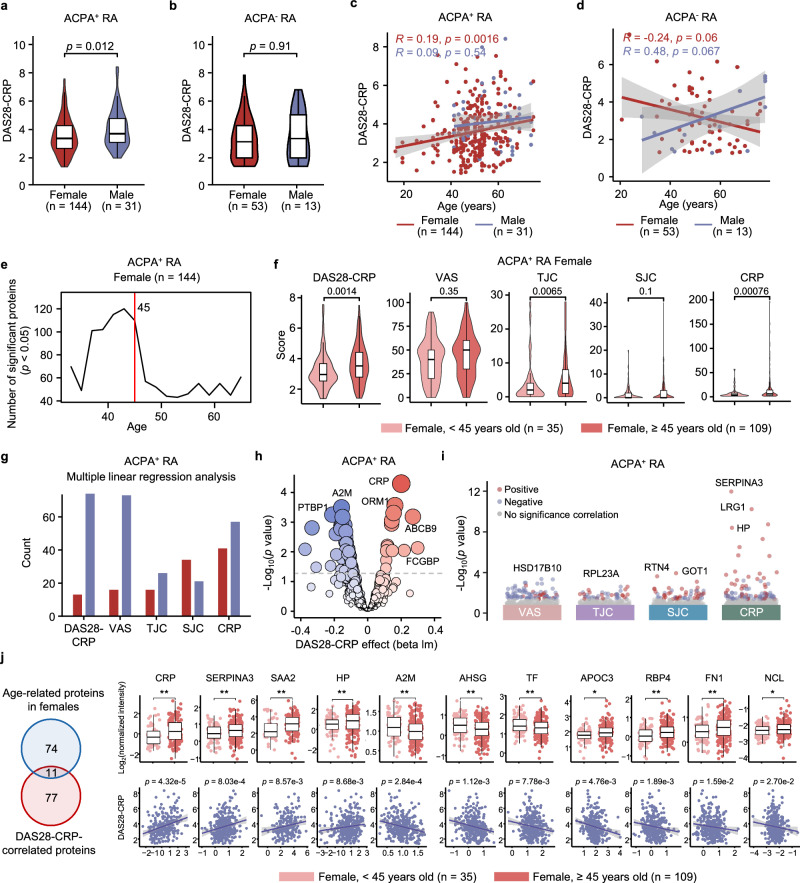
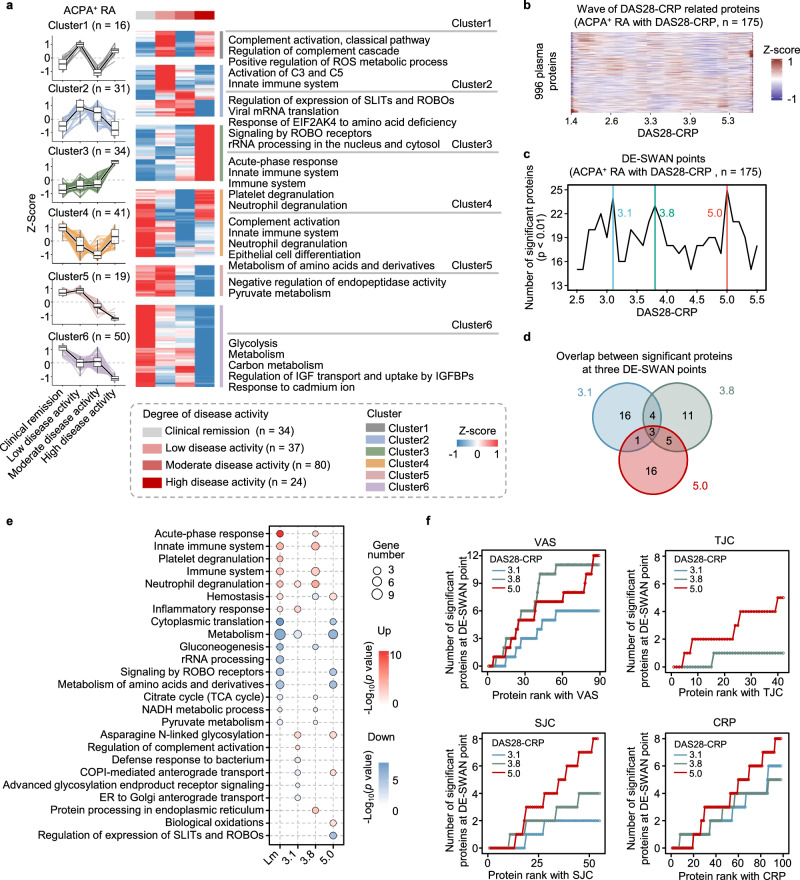
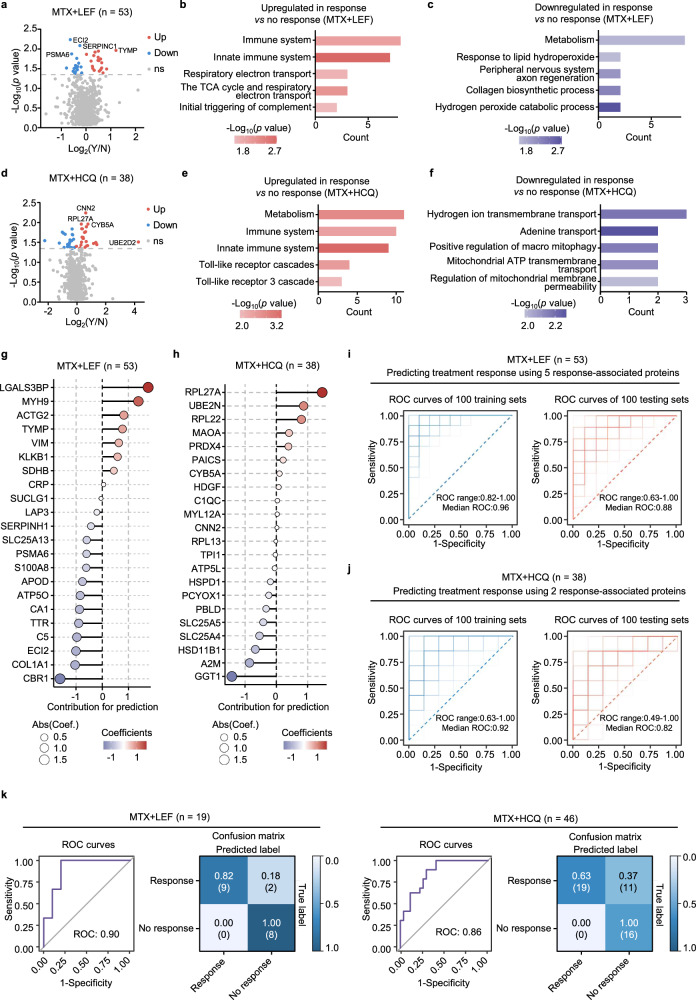
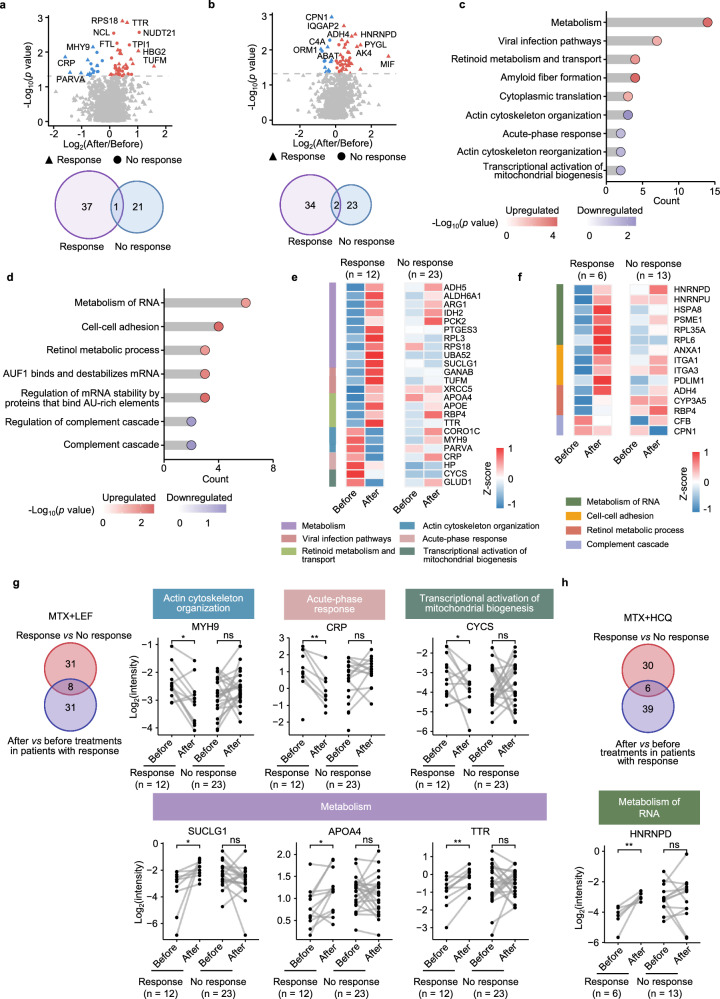
Rheumatoid arthritis (RA) is a systemic inflammatory condition posing challenges in identifying biomarkers for onset, severity and treatment responses. Here we investigate the plasma proteome in a longitudinal cohort of 278 RA patients, alongside 60 at-risk individuals and 99 healthy controls. We observe distinct proteome signatures in at-risk individuals and RA patients, with protein levels alterations correlating with disease activity, notably at DAS28-CRP thresholds of 3.1, 3.8 and 5.0. The combination of methotrexate (MTX) and leflunomide (LEF) modulates proinflammatory pathways, whereas MTX plus hydroxychloroquine (HCQ) impact energy metabolism. A machine-learning model is trained for predicting responses, and achieves average receiver operating characteristic (ROC) scores of 0.88 (MTX + LEF) and 0.82 (MTX + HCQ) in the testing sets. The efficiency of these models is further validated in independent cohorts using enzyme-linked immunosorbent assay data. Overall, our study unveils distinct plasma proteome signatures across various stages and subtypes of RA, providing valuable biomarkers for predicting disease onset and treatment responses.


Conflict of interest statement

Competing interests: The authors declare no competing interests.

Figures

Fig. 1
Fig. 1. Proteomic analysis workflow and quality control.
a Schematic design of the study (created with BioRender.com. Sun, R. (2025) https://BioRender.com/6iee3nb). b Bar plot (left) and pie charts (right) depicting the age and sex group distribution across different clinical subgroups. c Distribution of log2-transformed protein (n = 996) intensities normalized to those of common reference samples. Box plots showing the median (center line), the 25th and 75th percentiles (bounds of box), and the minimum and maximum values (whiskers). d Cumulative number of identified proteins for healthy controls (blue, n = 99), at-risk individuals (violet, n = 60), and RA patients (red, n = 278). ACPA+ indicates ACPA-positive, and ACPA indicates ACPA-negative. Source data are provided as a Source Data file.
Fig. 2
Fig. 2. Plasma proteomic heterogeneity during RA development.
a Number of individuals in different clinical subgroups. b Dendrogram illustrating hierarchical clustering of proteomic data across samples. c Heatmap displaying unsupervised k-means clustering of proteins across healthy individuals, at-risk individuals, ACPA-positive RA patients and ACPA-negative RA patients (two-sided Student’s t test, p < 0.05 and 1.5-fold change). The top enriched pathways for each cluster are shown (two-sided Fisher’s exact test, p < 0.05). d Volcano plot of differentially expressed proteins (DEPs) between at-risk individuals who converted to RAs (converters) and non-converters (two-sided Student’s t test, p < 0.05 and 1.5-fold change). The red and blue dots represent upregulated and downregulated proteins, respectively. e Bar plot displaying the top enriched pathways of DEPs between converters and non-converters (two-sided Fisher’s exact test). f Schematic (left) of proteomic analysis design for samples collected from three at-risk individuals before and after RA onset (created with BioRender.com. Sun, R. (2025) https://BioRender.com/6iee3nb). Venn diagram (middle) showing overlapped DEPs in two comparisons: red circle includes DEPs between converter and non-converter; blue circle includes DEPs before and after RA onset in three converters. Scatter plot (right) displaying the intensity of the overlapped DEPs before and after RA onset (two-sided Student’s t test). g Violin plot displaying the intensity of antibody segments across four clinical groups (two-sided Student’s t test). Box plots inside showing the median (center line), the 25th and 75th percentiles (bounds of box), and the minimum and maximum values (whiskers). ACPA+ indicates ACPA-positive, and ACPA- indicates ACPA-negative. Significance is indicated as follows: *p < 0.05, **p < 0.01 and ***p < 0.001, ns means p ≥ 0.05. Source data are provided as a Source Data file.
Fig. 3
Fig. 3. Impact of sex and age on disease activity and the proteome.
Violin chart of the DAS28-CRP scores grouped by sex in ACPA-positive (a) or ACPA-negative (b) RA patients (two-sided Student’s t test). Scatter plot with fitted regression lines illustrating Spearman’s correlation (two-sided p value) between age and DAS28-CRP grouped by sex in ACPA-positive (c) or ACPA-negative RA (d). Gray band represents 95% confidence interval estimated using standard error of the mean (SEM). e DE-SWAN analysis of proteins across age in ACPA-positive females, with a peak at age 45 indicated by the red line. f Violin plot illustrating age-specific differences in DAS28-CRP and 4 clinical indicators (VAS, SJC, TJC and CRP) in ACPA-positive females aged above and below 45 years (two-sided Student’s t test). gi Multiple linear regression analysis (adjusted for age and sex, two-sided p value < 0.05) between DAS28-CRP indicators and proteins in ACPA-positive RA patients (n = 175). Bar plot showing the number of proteins significantly correlated with DAS28-CRP indicators (g), bubble plot displaying the regression analysis between proteins and DAS28-CRP (h), and dot plot visualizing the regression analysis between proteins and VAS, TJC, SJC and CRP (i). j Venn diagram showing the overlap of proteins that exhibit significant changes between ACPA-positive females below and above 45 years or are significantly correlated with DAS28-CRP (left). Boxplots (right upper) displaying the normalized intensity of overlapped proteins across ACPA-positive females below and above 45 years (two-sided Student’s t test). Scatter plots (right below) showing regression analysis between proteins and DAS28-CRP (adjusted for age and sex, two-sided p value). Gray band represents 95% confidence interval estimated using SEM. ACPA+ indicates ACPA-positive, and ACPA indicates ACPA-negative. Significance is indicated as follows: *p < 0.05 and **p < 0.01. For box plots shown in (a, b, f, j), the center line represents the median; the bounds of the box indicate the 25th and 75th percentiles; and the whiskers extend to the minimum and maximum values. Source data are provided as a Source Data file.
Fig. 4
Fig. 4. In-depth exploration of disease activity-related protein dynamics.
a Unsupervised k-means clustering analysis of DEPs across four disease activity groups (two-sided Student’s t test, p < 0.05). The expression patterns of disease-related proteins in distinct clusters are shown on the left, with enriched pathways (more than 5 proteins) for each cluster on the right (two-sided Fisher’s exact test). Box plots inside showing the median (center line), the 25th and 75th percentiles (bounds of box), and the minimum and maximum values (whiskers). b Heatmap visualizing protein trajectories across DAS28-CRP. The trajectories of 996 proteins are estimated using LOESS. c The number of DEPs across disease activity levels. DE-SWAN identified three local peaks at DAS28-CRP values of 3.1, 3.8, and 5.0. d Overlap of proteins with significant differential expression at the three local peaks. e Bubble plot visualizing the enriched pathways of significant proteins identified through linear regression with DAS28-CRP and at three peaks in DE-SWAN (two-sided Fisher’s exact test, p < 0.05). f Line plot visualizes the results of the linear regression analysis of proteins (significant at DAS28-CRP values of 3.1, 3.8, and 5.0 in DE-SWAN) with VAS, TJC, SJC, and CRP. The cumulative number of overlapped proteins that are significant either at DE-SWAN points or in relation to the four parameters is shown, with proteins ranked based on significance from the linear regression models (adjusted for age and sex, two-sided p value < 0.05). Source data are provided as a Source Data file.
Fig. 5
Fig. 5. Machine learning-driven discovery of key proteins for predicting the response to csDMARDs treatment.
a Volcano plot of DEPs between response and no response to MTX + LEF treatment (two-sided Student’s t test, p < 0.05). Y = response, N = no response. Enrichment analysis of upregulated (b) and downregulated (c) proteins in response vs no response to MTX + LEF treatment (two-sided Fisher’s exact test, p < 0.05). d Volcano plot of DEPs between response and no response to MTX + HCQ treatment (two-sided Student’s t test, p < 0.05). Y = response, N = no response. Enrichment analysis of upregulated (e) and downregulated (f) proteins in response vs no response to MTX + HCQ treatment (two-sided Fisher’s exact test, p < 0.05). LASSO regression analysis showing the contribution of DEPs to treatment response prediction in the MTX + LEF (g) and MTX + HCQ (h) groups. ROC curves illustrating the predictive performance of the LASSO model for MTX + LEF (i) and MTX + HCQ (j) responses, using the top 5 or 2 proteins, respectively, in both the training (left) and testing (right) sets, with 10-fold cross-validation repeated 100 times. k ROC curve showing model performance after integrating protein levels measured by ELISA. The confusion matrix displays sensitivity and specificity at the optimal cutoff for the MTX + LEF (left) and MTX + HCQ (right) groups. Source data are provided as a Source Data file.
Fig. 6
Fig. 6. Plasma protein signatures in csDMARDs-treated RA patients with different responses.
a Volcano plots showing DEPs before and after MTX + LEF treatment, stratified by treatment response (response, n = 12; no response, n = 23) (paired two-sided Student’s t test, p < 0.05). b Volcano plots showing DEPs before and after MTX + HCQ treatment, stratified by treatment response (response, n = 6; no response, n = 13) (paired two-sided Student’s t test, p < 0.05). c Pathway enrichment analysis of DEPs before and after MTX + LEF treatment in response (two-sided Fisher’s exact test). d Pathway enrichment analysis of DEPs before and after MTX + HCQ treatment in response (two-sided Fisher’s exact test). e Heatmap of the relative abundance of DEPs before and after MTX + LEF treatment, separated by response. f Heatmap of the relative abundance of DEPs before and after MTX + HCQ treatment, separated by response. Venn diagrams displaying overlap of treatment- and response-related proteins for MTX + LEF (response, n = 12; no response, n = 23) (g) and MTX + HCQ (response, n = 6; no response, n = 13) (h) therapies, grouped by response, with corresponding dot plots illustrating the differential expression of these proteins among groups (paired two-sided Student’s t test). Significance is indicated as follows: *p < 0.05, **p < 0.01, ns means p ≥ 0.05. Source data are provided as a Source Data file.

Similar articles

References

    1. Smolen, J. S. et al. EULAR recommendations for the management of rheumatoid arthritis with synthetic and biological disease-modifying antirheumatic drugs: 2022 update. Ann. Rheum. Dis.82, 3–18 (2023). - PubMed
    1. Weyand, C. M. & Goronzy, J. J. The immunology of rheumatoid arthritis. Nat. Immunol.22, 10–18 (2021). - PMC - PubMed
    1. Mun, S. et al. Serum biomarker panel for the diagnosis of rheumatoid arthritis. Arthritis Res. Ther.23, 31 (2021). - PMC - PubMed
    1. Holmdahl, R., Malmström, V. & Burkhardt, H. Autoimmune priming, tissue attack and chronic inflammation - the three stages of rheumatoid arthritis. Eur. J. Immunol.44, 1593–1599 (2014). - PubMed
    1. Rantapää-Dahlqvist, S., Boman, K., Tarkowski, A. & Hallmans, G. Up regulation of monocyte chemoattractant protein-1 expression in anti-citrulline antibody and immunoglobulin M rheumatoid factor positive subjects precedes onset of inflammatory response and development of overt rheumatoid arthritis. Ann. Rheum. Dis.66, 121–123 (2007). - PMC - PubMed

MeSH terms