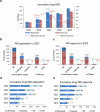
Current landscape of innovative drug development and regulatory support in China
- PMID: 40691459
- PMCID: PMC12280122
- DOI: 10.1038/s41392-025-02267-y
Current landscape of innovative drug development and regulatory support in China
Abstract
The global pharmaceutical landscape remains dynamic and competitive, shaped by advancements in first-in-class therapies and breakthrough technologies. The United States has maintained its leadership in first-in-class therapies and breakthrough technologies, driven by advanced regulatory pathways, significant multinational corporation investments, a robust Research and Development (R&D) workforce, and continuous technological innovation. Additionally, global impact of the Food and Drug Administration (FDA) is further amplified through collaborations like Project Orbis, which facilitates simultaneous reviews of cancer treatments by multiple regulatory authorities worldwide. Europe, while historically strong, faces growing challenges in maintaining its competitive edge, particularly due to protracted regulatory timelines and complex coordination among its member states. In this competitive global environment, China has rapidly transformed from a generics-dominated market to a key player in innovative drug development. This article reviews China's progress in innovative drug R&D from 2019 to 2023, emphasizing regulatory modernization, clinical trial advancements, and the emergence of novel therapies. By comparing China's developments with above global counterparts, this review highlights the country's achievements in regulatory efficiency, clinical trial progress, and the development of innovative therapies such as biologics and cell and gene therapies. Through this comparative analysis, the article underscores how China's evolving policy-driven innovation ecosystem has positioned it as a growing leader in global drug development. The review examines how enhanced regulatory efficiency, clinical trial progress, manufacturing capabilities, and international collaboration have bolstered China's growing influence, while also discussing the future opportunities and challenges it faces in shaping global pharmaceutical innovation and development.
© 2025. The Author(s).
Conflict of interest statement
Competing interests: The authors declare no competing interests.
Figures


Similar articles
-
Digital Therapeutics in China: Comprehensive Review.J Med Internet Res. 2025 May 27;27:e70955. doi: 10.2196/70955. J Med Internet Res. 2025. PMID: 40424619 Free PMC article. Review.
-
Management of urinary stones by experts in stone disease (ESD 2025).Arch Ital Urol Androl. 2025 Jun 30;97(2):14085. doi: 10.4081/aiua.2025.14085. Epub 2025 Jun 30. Arch Ital Urol Androl. 2025. PMID: 40583613 Review.
-
The Black Book of Psychotropic Dosing and Monitoring.Psychopharmacol Bull. 2024 Jul 8;54(3):8-59. Psychopharmacol Bull. 2024. PMID: 38993656 Free PMC article. Review.
-
[Volume and health outcomes: evidence from systematic reviews and from evaluation of Italian hospital data].Epidemiol Prev. 2013 Mar-Jun;37(2-3 Suppl 2):1-100. Epidemiol Prev. 2013. PMID: 23851286 Italian.
-
From traditional medicine to modern medicine: the importance of TCM regulatory science (TCMRS) as an emerging discipline.Chin Med. 2025 Jun 26;20(1):92. doi: 10.1186/s13020-025-01152-8. Chin Med. 2025. PMID: 40563101 Free PMC article. Review.
References
-
- Shmela, M. & Habbassi, M. Overview in EMA and FDA approved novel drugs in thE YEARS 2020, 2021 and 2022. Libyan. J. Med.18, 178–192 (2024).
-
- Scott, E. C. et al. Trends in the approval of cancer therapies by the FDA in the twenty-first century. Nat. Rev. Drug Discov.22, 625–640 (2023). - PubMed
-
- Kinch, M. S., Kraft, Z. & Schwartz, T. 2023 in review: FDA approvals of new medicines. Drug Discov. Today.29, 103966 (2024). - PubMed
-
- Rim, M. H., Barada, F. & Levitsky, A. M. Recent and anticipated novel drug approvals for 2023 and 2024. Am. J. Health Syst. Pharm.80, 1729–1732 (2023). - PubMed
Publication types
MeSH terms
LinkOut - more resources
Full Text Sources

