. 2025 Jul 21;16(1):6723.
doi: 10.1038/s41467-025-62051-y.

The hit-and-run of cell wall synthesis: LpoB transiently binds and activates PBP1b through a conserved allosteric switch

Affiliations

The hit-and-run of cell wall synthesis: LpoB transiently binds and activates PBP1b through a conserved allosteric switch

Irina Shlosman et al. Nat Commun. .

Abstract

The peptidoglycan (PG) cell wall is the primary protective layer of bacteria, making the process of PG synthesis a key antibiotic target. Class A penicillin-binding proteins (aPBPs) are a family of conserved and ubiquitous PG synthases that fortify and repair the PG matrix. In gram-negative bacteria, these enzymes are regulated by outer-membrane tethered lipoproteins. However, the molecular mechanism by which lipoproteins coordinate the spatial recruitment and enzymatic activation of aPBPs remains unclear. Here we use single-molecule FRET and single-particle tracking in E. coli to show that a prototypical lipoprotein activator LpoB triggers site-specific PG synthesis by PBP1b through conformational rearrangements. Once synthesis is initiated, LpoB affinity for PBP1b dramatically decreases and it dissociates from the synthesizing enzyme. Our results suggest that transient allosteric coupling between PBP1b and LpoB directs PG synthesis to areas of low peptidoglycan density, while simultaneously facilitating efficient lipoprotein redistribution to other sites in need of fortification.


Conflict of interest statement

Competing interests: A.C.K. is a cofounder and consultant for biotechnology companies Tectonic Therapeutic and Seismic Therapeutic, and for the Institute for Protein Innovation, a non-profit research institute. The remaining authors declare no competing interests.

Figures
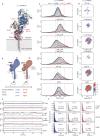
Fig. 1
Fig. 1. LpoB stabilizes the activated state of PBP1b.
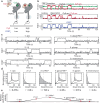
a AlphaFold model of full-length EcPBP1b showing the positions of cysteine substitutions (black spheres) and suppressor variants (red sticks). b Schematic illustrating the smFRET assay, with one of the two possible orientations of donor (green) and acceptor (red) labels shown for simplicity. In the apo state, PBP1b adopts a lower-FRET efficiency state (inactive state). Activating perturbations (suppressor variants, lipid II or LpoB addition) shift the conformation of PBP1b to higher-FRET states. c Probability density (PDF) histograms and fits of FRET efficiency (FE) values derived from single-molecule trajectories of EcPBP1bE187C-R300C WT and suppressor variants (Q411R, I202F), with or without LpoB and lipid II. Normal fits to the data are shown in a blue-to-red color gradient, with states numbered 1-4. Mean values and occupancies of smFRET states are summarized in SI Table 1. d Transition density heat maps, normalized to the total observation time, show the frequency of transitions for datasets in (c). White-to-red color gradient depicts the frequency of transitions from a starting FRET value (x-axis) to the final FRET value (y-axis), with white color corresponding to absence of transitions and red corresponding to high frequency of transitions. e Representative single-molecule trajectories from datasets in (c). Markers are plotted at the mean values of state fits and colored as in (c). f Dwell time histograms and fits for the states observed in datasets from (c). Mean dwell times alongside 95% confidence intervals are indicated on the plots. Conditions in which the protein remained largely static were omitted from analysis.
Fig. 2
Fig. 2. Affinity-matured LpoB variants stabilize active and inactive states of PBP1b.
a LpoB sequence, showing the truncation that was displayed on yeast for selections (LpoB64-213) as well as the variable regions of LpoB (LpoB110-117, LpoB152-191), in which all possible amino acid substitutions were incorporated at each position. Key interfaces are colored in orange (loop 1), green (loop 2), magenta (β3), and red (loop 4). b AlphaFold model of the PBP1b-LpoB complex, showing the positions of the identified mutations as spheres. Interaction regions are colored as in (a). c Bar graph summarizes BLI-determined affinities of LpoB variants color-coded by their positions in either loop2 or β3, as in (a). Data are shown as mean +/- standard deviation, with biological replicates (n = 3) overlayed as dots. Full statistics can be found in SI Table 2. d PDF histograms of FRET efficiency values derived from single-molecule trajectories of EcPBP1bE187C-R300C in the presence of 1 μM LpoB WT or engineered LpoB variants. WT LpoB data are reproduced from Fig. 1 for convenience.
Fig. 3
Fig. 3. Cellular growth and survival scale with activation efficiency of LpoB variants.
a Growth curves under non-permissive growth conditions (½ LB 0 NaCl 42 oC) of ∆ponA Para::ponA ∆lpoB negative control (black), ∆ponA Para::ponA ∆lpoB Plac::lpoB WT (grey) or engineered LpoB variants (red). Averages of three technical replicates are shown as lines, with standard deviation depicted as a shaded region. In the absence of induction, strains of higher affinity variants that retain the ability to activate PBP1b exhibit modestly faster growth than the WT strains. Strains of LpoB mutants that disrupt binding to PBP1b (E201R) or enzymatic activation (Y178W) fail to grow. b Titer experiments with strains from (a). Overnight cultures were serially diluted and spotted on LB agar with either 0.2% arabinose, 0.2% glucose, 25 μM IPTG or 100 μM IPTG. Data shown in (a, b) are representative of three biological replicates.
Fig. 4
Fig. 4. LpoB preferentially promotes glycan synthesis initiation.
a Schematic illustrating the PBP1b-LpoB smFRET binding assay. Cy3-labeled PBP1b is tethered to the surface, whereas Cy5-labeled LpoB is supplied in solution. In this set-up, Cy5 fluorescence and FRET signal are detected only when LpoB binds PBP1b. b Example trajectories, showing donor and acceptor fluorescence upon donor excitation (top), acceptor fluorescence upon acceptor excitation (middle) and the calculated FRET efficiency signal (bottom). Anti-correlated changes in donor and acceptor fluorescence (top) correspond to FRET transitions (bottom) and perfectly correlate with changes in direct acceptor signal (middle), i.e., Cy5-Cy3 colocalization events. c Example trajectories of LpoB binding either to apo PBP1b or to PBP1b complexed with lipid II substrate or glycan chains. Step-like increases and decreases in FRET efficiency correspond to association and dissociation events, respectively. d Dwell time histograms and exponential fits of samples from (c) with mean fits indicated on the figure. Insets show enlarged views of the histograms and fits in the 0 to 5 s range. Full binding statistics are summarized in the SI Table 3. e Schematic illustrating the relative changes in the stability of the PBP1b-LpoB complex throughout the polymerization reaction.
Fig. 5
Fig. 5. PBP1b synthesis time is independent of its intrinsic affinity for LpoB.
a Representative jump distance distributions (over a period of 5 steps in length) and fits of strains expressing PBP1b-Halo-WT (TU122/pAV23, blue) and PBP1b-Halo-I202F mutant (TU122/pSI237, red), alongside the fixed cell control (TU122/pAV23, grey), imaged with a fast acquisition rate (30 ms). The chosen immobile threshold is shown as a dotted line. The I202F strain exhibits a 15–20%-fold increase (p < 0.05) in the population of the bound (active) state relative to the WT sample. Data collection parameters and statistics are summarized in SI Table 4. Distributions and fits were generated using Spot-ON sp-tracking software. b Example single-particle trajectories of strains from (a) of PBP1b-Halo-WT (blue), PBP1b-Halo-I202F mutant (red) and the fixed cell control (grey) imaged with a slower acquisition rate (225 ms). Periods of immobility (active synthesis or tethering to LpoB) correspond to step-like decreases in the instantaneous step size of the diffusing particle below the threshold value of 70 nm (dotted line). The fixed cell control shows few if any rapidly diffusing particles and has much longer periods of immobility. c Dwell time distribution histograms and exponential fits of samples from (b). PBP1b-WT and the I202F mutant exhibit similar dwell times of the bound (active) state.
Fig. 6
Fig. 6. LpoB forms a transient complex with PBP1b, triggering synthesis initiation.
Schematic overview shows the model of LpoB-mediated PG synthesis by PBP1b. Outside of areas of low PG density, low substrate availability and low PBP1b affinity for lipid II in the apo state (blue state) prevent the enzyme from efficiently initiating synthesis. Once PBP1b encounters LpoB at a gap in the PG matrix, LpoB binding induces conformational changes within the enzyme (red state), increasing substrate affinity and promoting synthesis initiation. As polymerization progresses (elongation), LpoB affinity for PBP1b decreases through a yet-unknown mechanism (grey state) and it is recycled from the synthesizing complex before the repair process can close off its escape route. PBP1b is retained on the PG substrate and completes synthesis.

Update of

Similar articles

References

    1. Silver, L. L. Viable screening targets related to the bacterial cell wall. Ann. N. Y Acad. Sci.1277, 29–53 (2013). - PubMed
    1. Fleming, A. On the antibacterial action of cultures of a penicillium, with special reference to their use in the isolation of B. influenzae. 1929. Bull. World Health Organ79, 780–790 (2001). - PMC - PubMed
    1. Papp-Wallace, K. M., Endimiani, A., Taracila, M. A. & Bonomo, R. A. Carbapenems: past, present, and future. Antimicrob. Agents Chemother.55, 4943–4960 (2011). - PMC - PubMed
    1. Bush, K. & Bradford, P. A. beta-Lactams and beta-Lactamase Inhibitors: An Overview. Cold Spring Harb Perspect Med610.1101/cshperspect.a025247 (2016). - PMC - PubMed
    1. Tooke, C. L. et al. beta-Lactamases and beta-Lactamase Inhibitors in the 21st Century. J. Mol. Biol.431, 3472–3500 (2019). - PMC - PubMed

MeSH terms

Substances

LinkOut - more resources