. 2025 Jul 21;8(1):1082.
doi: 10.1038/s42003-025-08514-w.

Inactivation of SARS-CoV-2 at acidic pH is driven by partial unfolding of spike

Affiliations

Inactivation of SARS-CoV-2 at acidic pH is driven by partial unfolding of spike

Irina Glas et al. Commun Biol. .

Abstract

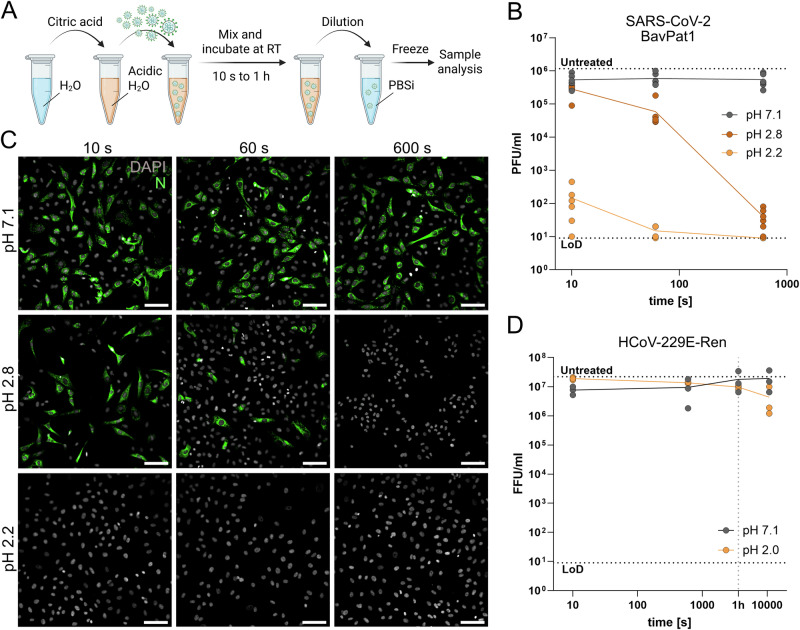
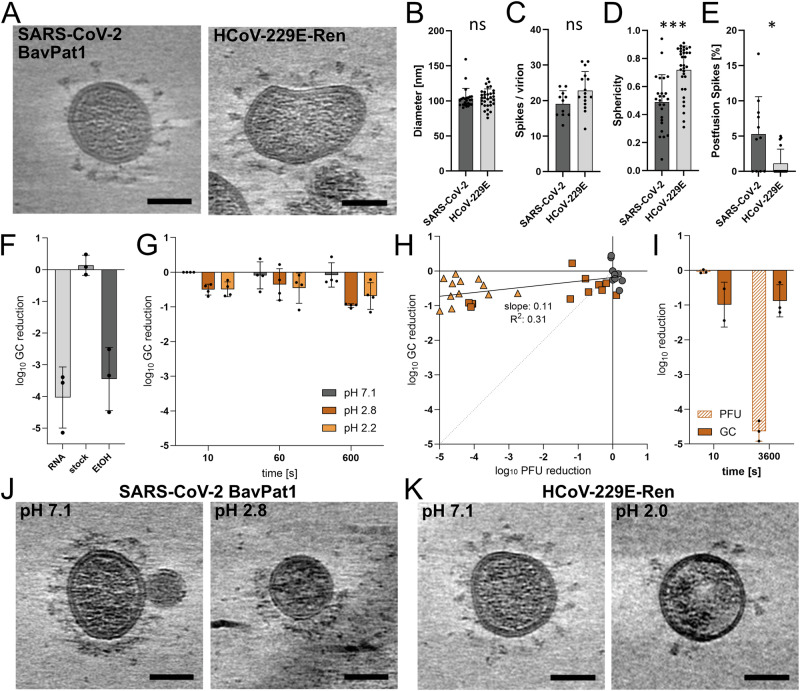
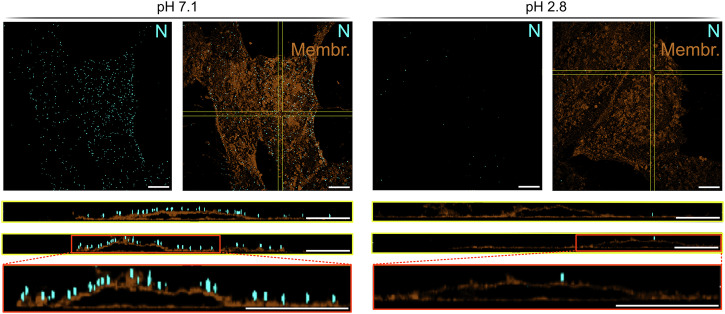
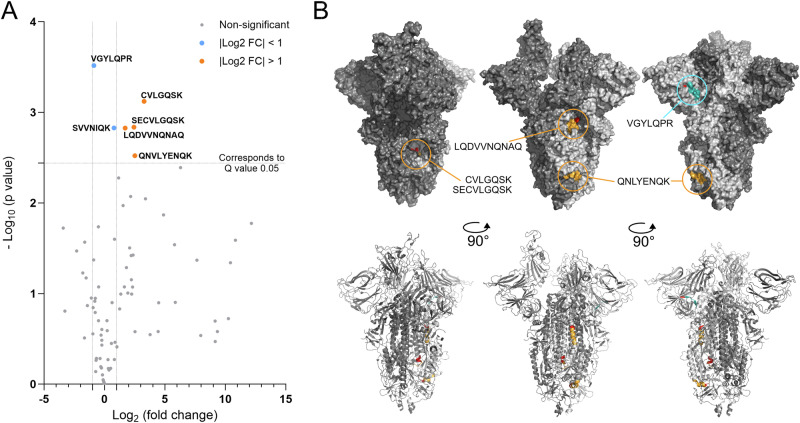
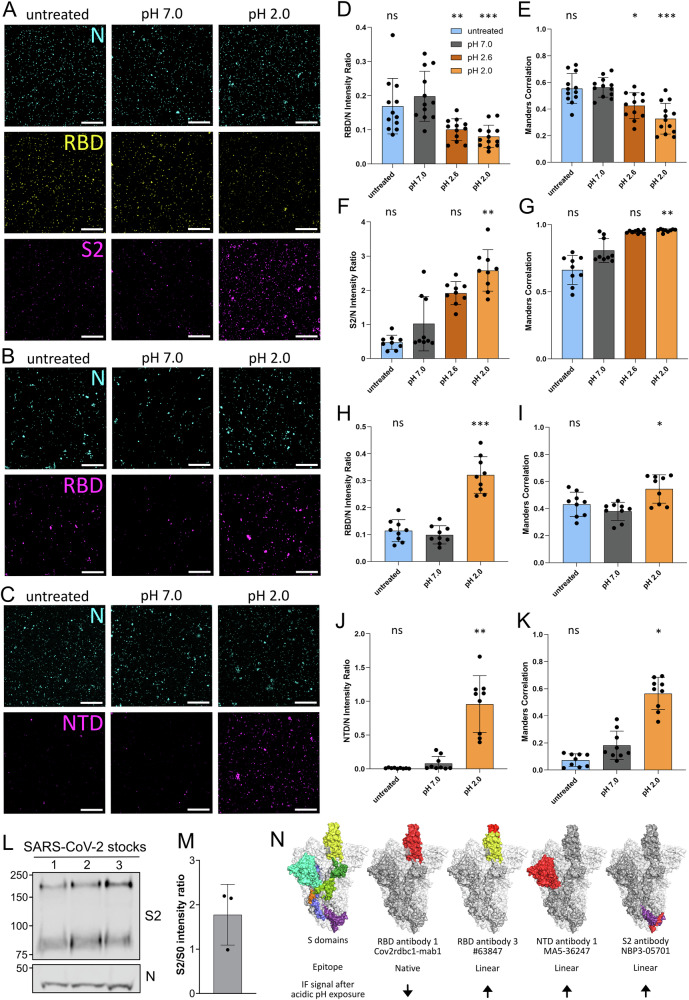
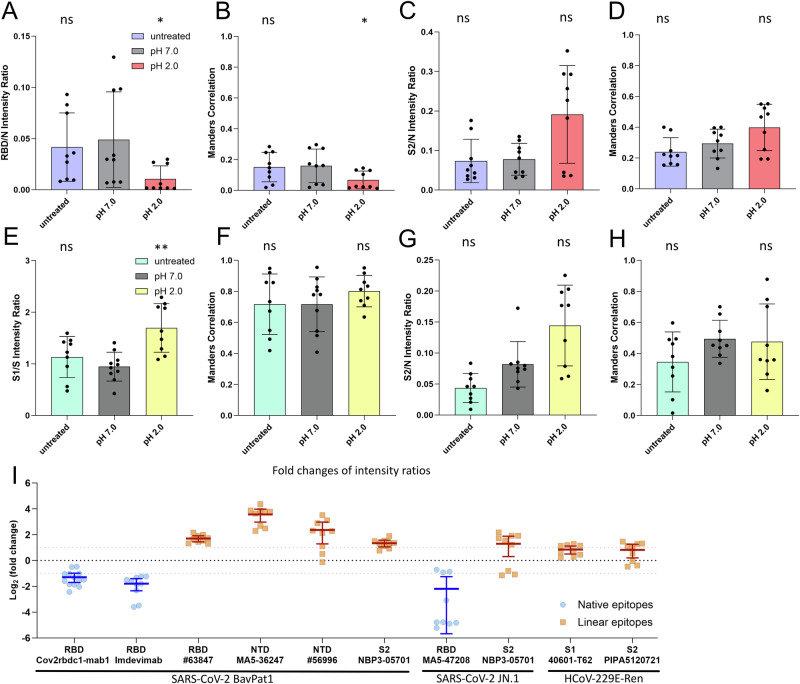
SARS-CoV-2, the causative agent of COVID-19, is predominantly transmitted by respiratory aerosol and contaminated surfaces. Recent studies demonstrated that aerosols can become acidic, and acidification has been proposed as decontamination method. Here, we investigate how SARS-CoV-2 reacts to acidic pH and by which mechanism the virus is inactivated. We show that a pH below 3 is required to inactivate SARS-CoV-2 in a period of seconds to minutes. While we measured a 1000 to 10,000-fold drop in infectivity, virion structure remained intact under these conditions. Using super-resolution microscopy, we found that the attachment of virions to target cells is abrogated after acidic treatment, revealing spike protein (S) as the major inactivation target. Limited proteolysis of S combined with testing spike-specific antibodies for binding under low pH conditions revealed that exposure of SARS-CoV-2 to pH below 3 results in partial unfolding of S, thereby preventing binding of virions to target cells.


Conflict of interest statement

Competing interests: The authors declare no competing interests.

Figures

Fig. 1
Fig. 1. SARS-CoV-2 BavPat1, but not HCoV-229E-Ren, is efficiently inactivated at a pH of 2.2.
A Scheme showing the sample preparation in bulk solutions. Virus is spiked into an acidic environment and incubated at RT. At each time point, a sample is taken from the reaction and neutralized by a 1:100 dilution in PBSi (additionally buffered at pH 7). Created in BioRender. Glas, I. (2025) https://BioRender.com/o9x4cqe. B Inactivation curves in PFU/ml of SARS-CoV-2 BavPat1 over time at pH 7.1, 2.8, and 2.2 determined by plaque assay from three independent experiments done in duplicates. Samples were generated as shown in (A). Dotted lines indicate titer measured in the untreated control and the limit of detection (LoD). C IF images of VAT cells infected with neutralized SARS-CoV-2 BavPat1 samples treated for 10 s, 1 min (60 s) or 10 min (600 s) at pH 7.1, 2.8 or 2.2. Infected VAT cells were fixed at 7 hpi and subsequently stained for SARS-CoV-2 N (green) and with Dapi (gray). Shown are representative images from two independent experiments done in duplicates. Scale bar corresponds to 100 µm. D Inactivation curves in Foci forming units (FFU)/ml of HCoV-229E-Ren over time at pH 7.1 and 2.0 measured by foci assay from three independent experiments. Dotted lines indicate titer measured in the untreated control and the LoD as well as the 1 h time point.
Fig. 2
Fig. 2. Virion characterization and integrity of pH treated SARS-CoV-2 BavPat1 and HCoV-229E-Ren samples.
A Slices of tomograms showing virions from cell culture supernatants of SARS-CoV-2 BavPat1 and HCoV-229E-Ren infected cells. The scale bar corresponds to 50 nm. Quantification of untreated SARS-CoV-2 BavPat1 and HCoV-229E-Ren tomograms from n = 25 and n = 32 virions, respectively: Virion diameter in nm (B), number of S per virion (C), sphericity (D), and percentage of S in the post-fusion conformation (E). Tomograms were derived from a single SARS-CoV-2 BavPat1 or HCoV-229E-Ren sample. Statistical tests were performed using the unpaired, nonparametric Mann–Whitney test (two-tailed) in GraphPad Prism. Data was considered non-significant (ns) if p values were 0.05 or above and significant for p values below 0.05 (p < 0.05 (*), p < 0.005 (**), p < 0.0005 (***)). F Control panel introducing the RNA digestion assay. Intact SARS-CoV-2 BavPat1 virions are able to protect their genetic material from nucleases, while free or accessible RNA is digested during RNase treatment. Included are a free RNA control (RNA), a virus stock sample (stock) and a virus stock sample lysed with 80% ethanol (EtOH). GC numbers were determined by qPCR on the E segment and the GC loss calculated and log10 transformed. Shown are average values from n = 3 independent experiments. G Calculated log10 loss of GC after RNA digestion normalized to the pH 7.1 10 s sample. SARS-CoV-2 BavPat1 samples were generated as shown in Fig. 1A, subsequently exposed to RNases, and GC numbers were determined by qPCR. Shown are average values from n = 4 replicates derived from three independent experiments. H Data in (G) correlated with the corresponding log10 of the loss in PFU/ml of each sample calculated from the data shown in Fig. 1B. Linear regression was performed using GraphPad Prism (n = 36). The coefficient of determination (R²) is 0.31. The slope is 0.11 (95% CI: [0.05, 0.17]), with a p value of 0.0004. Dotted line represents a perfect correlation. I As described in (G), log10 loss in GC numbers and PFU were calculated for SARS-CoV-2 BavPat1 samples with increased reaction titer and protein content during the pH inactivation at pH 2.8. Data was derived from n = 3 independent replicates. Slices of tomograms showing SARS-CoV-2 BavPat1 virions (J) or HCoV-229E-Ren virions (K) treated at pH 7.1, pH 2.8, or pH 2.0. The scale bar corresponds to 50 nm. In (BGI) data are means with the error bars representing the standard deviation (SD).
Fig. 3
Fig. 3. SARS-CoV-2 BavPat1 virions lose cell binding ability after low pH treatment.
VAT cells were incubated with neutralized SARS-CoV-2 BavPat1 samples (treated with pH 7.1 or pH 2.8 beforehand) for 1.5 h on ice. Subsequently, VAT cells with bound virus were fixed, permeabilized, stained for N (cyan) and with CellBrite 680, a membrane dye (brown), and imaged by super resolution microscopy. Shown are maximal z-projections of representative cells as well as extended y-z-sections and x-z sections as indicated with yellow lines. The red boxes show magnified images of the x-z-section. Scale bars correspond to 10 µm. Four to eight z-stacks were acquired per condition in each of three independent experiments.
Fig. 4
Fig. 4. Peptide candidates determined by LiP LC-MS after pH treatment of recombinant S.
A Volcano plot showing the Log2 fold change of all S peptides derived from the pH 2.0 sample compared to the pH 7.0 sample. The negative log10 p values are shown on the Y-axis. Peptides with a higher negative log10 p value than 2.439 (corresponding to a Q value of 0.05) were considered significant. Dotted lines indicate log2 fold changes of −1 and 1 as well as the significance threshold. Peptides with significant changes above a log2 fold change of 1 were colored orange, while peptides with significant changes below 1 were colored blue. Data was derived from n = 4 technical replicates per condition. Raw data are available via ProteomeXchange with identifier PXD064612. B S trimer structure (PDB ID: 6ZGG) from different angles showing the location of significant peptides. The upper row shows the surface view, while the lower row shows the cartoon view. Peptides with significant changes were visualized on a single monomer (light gray). Significant peptides above a log2 fold change of 1 were colored orange, while peptides with significant changes below 1 were colored blue. Proteinase K cleavage sites were colored red for each peptide. Of note, the peptide “SVVNIQK” is in an unresolved region of S2 and therefore not depicted.
Fig. 5
Fig. 5. SARS-CoV-2 BavPat1 RBD, NTD and S2 structure is affected by acidic pH.
A–C SARS-CoV-2 BavPat1 virions were bound to coverslips and subsequently given a pH pulse for 1 min or left untreated (pH 7.0, pH 2.6, pH 2.0, and untreated). After fixation and permeabilization, virions were stained for N as a control (cyan) and different S antibodies. In (A) a neutralizing RBD antibody (Cov2rbdc1-mab1, yellow) and an S2 antibody (NBP3-05701, magenta) were used, in (B) virions were stained with an RBD antibody (#63847, magenta) exhibiting a preference for linear epitopes, and in (C) virions were stained with the NTD antibody (MA5-36247, magenta). Samples were imaged with the SP8 (Leica). Shown are representative images from three to four independent replicates. Scale bar corresponds to 10 µm. D–K Quantification of three to four images per pH condition from three to four independent experiments each (n = 9 per group, except D, E where n = 12 for undiluted, pH 7.0 and pH 2.6 and n = 13 for pH 2.0). In brief, a background cut-off was defined for each channel and subtracted from the images. Only pixels positive for N were considered in the following analyses to further reduce background and processing artefacts. For each image, the intensity ratio of the S antibody signal to the N signal was calculated for the neutralizing RBD Cov2rbdc1-mab1 (D), the S2 NBP3-05701 (F), the RBD #63847 (linear epitope preference) (H) and the NTD MA5-36247 (J) antibody. Additionally, the Manders correlation coefficient M1 was calculated using Coloc 2 (ImageJ), measuring the fraction of the N intensity signal associated with the neutralizing RBD Cov2rbdc1-mab1 (E), the S2 NBP3-05701 (G), the RBD #63847 (linear epitope preference) (I) or the NTD MA5-36247 (K) antibody signal. Error bars represent SD from the mean. All statistical tests were done with a nonparametric one-way ANOVA (Kruskal–Wallis test, two-sided) in GraphPad Prism with all conditions compared to the pH 7.0 control. Data was considered non-significant (ns) if p values were 0.05 or above and significant for p values below 0.05 (p < 0.05 (*), p < 0.005 (**), p < 0.0005 (***)). L WB of three different SARS-CoV-2 stock preparations (1, 2, and 3) showing N and S. Full-length S0 as well as the S2 subunit were detected with the S2 antibody. M Full-lengths S0 and S2 in (L) were quantified using Image Studio Lite and the S2 to full-length S0 ratio was calculated (n = 3). Error bars represent SD from the mean. N Epitopes of used antibodies visualized on S trimers with one monomer in the open conformation (PDB ID: 6ZGG). For each antibody, the structural epitope preference (linear or native) is indicated as well as the IF signal increase (↑) or decrease (↓) after treatment at pH 2.0. S domains were colored on one monomer of the trimer in the open conformation: NTD (turquois), RBD (yellow), CTD1 (dark green), CTD2 (light green), fusion peptide (orange), central helix (dark blue), heptad repeat 1 (HR1, light blue) and HR2 (purple). For each antibody, the epitope was colored in red, and overlapping domains were colored in the assigned colors. If the epitope was unknown within the S domain, the whole domain was colored red.
Fig. 6
Fig. 6. Structural changes of SARS-CoV-2 JN.1 S and HCoV-229E S.
SARS-CoV-2 JN1 virions (AD) or HCoV-229E-Ren virions (EH) were bound to coverslips and subsequently given a pH pulse for 1 min or left untreated (pH 7.0, pH 2.0, and untreated). As in Fig. 5D–H, the intensity ratio of the neutralizing SARS-CoV-2 JN.1 RBD MA5-47208 (A), the SARS-CoV-2 S2 NBP3-05701 (C), the HCoV-229E S1 40601-T62 (E) and the HCoV-229E S2 PIPA5120721 (G) antibody signal to the corresponding N signal was calculated for each image. Additionally, the Manders correlation coefficient M1 was calculated for the neutralizing SARS-CoV-2 JN.1 RBD MA5-47208 (B), the SARS-CoV-2 S2 NBP3-05701 (D), the HCoV-229E S1 40601-T62 (F) and the HCoV-229E S2 PIPA5120721 (H) antibody signal. Error bars represent SD from the mean of three images derived from three independent experiments (n = 9 per group). All statistical tests were done with a nonparametric one-way ANOVA (Kruskal-Wallis test, two-sided) in GraphPad Prism with all conditions compared to the pH 7.0 control. Data was considered non-significant (ns) if p values were 0.05 or above and significant for p values below 0.05 (p < 0.05 (*), p < 0.005 (**), p < 0.0005 (***)). I Log2 fold changes calculated for the intensity ratios of all antibodies used in the study comparing the pH 2.0 to the pH 7.0 condition. Antibodies with a preference for native epitopes are depicted by blue circles, while antibodies with a preference for linear epitopes are depicted by orange squares. Dotted lines indicate a log2 fold change of −1 or 1. Error bars show the 95% CI of the mean for each antibody (n = 9 per group, except RBD antibodies Imdevimab where n = 10 and Cov2rbdc1-mab1 where n = 13).

Similar articles

References

    1. World Health Organization (WHO). WHO COVID-19 dashboard, accessed 19 June 2024 https://data.who.int/dashboards/covid19/deaths?n=o.
    1. Peacock, T. P. et al. The furin cleavage site in the SARS-CoV-2 spike protein is required for transmission in ferrets. Nat. Microbiol.6, 899–909 (2021). - PubMed
    1. Rachid, E. et al. Distinctive roles of furin and TMPRSS2 in SARS-CoV-2 infectivity. J. Virol.96, e00128–22 (2022). - PMC - PubMed
    1. Jackson, C. B., Farzan, M., Chen, B. & Choe, H. Mechanisms of SARS-CoV-2 entry into cells. Nat. Rev. Mol. Cell Biol.23, 3–20 (2022). - PMC - PubMed
    1. Hoffmann, M. et al. SARS-CoV-2 cell entry depends on ACE2 and TMPRSS2 and is blocked by a clinically proven protease inhibitor. Cell181, 271–280.e8 (2020). - PMC - PubMed

Substances

LinkOut - more resources