

Nitrogen limitation causes a seismic shift in redox state and phosphorylation of proteins implicated in carbon flux and lipidome remodeling in Rhodotorula toruloides
- PMID: 40691609
- PMCID: PMC12278674
- DOI: 10.1186/s13068-025-02657-y
Nitrogen limitation causes a seismic shift in redox state and phosphorylation of proteins implicated in carbon flux and lipidome remodeling in Rhodotorula toruloides
Abstract
Background: Oleaginous yeast are prodigious producers of oleochemicals, offering alternative and secure sources for applications in foodstuff, skincare, biofuels, and bioplastics. Nitrogen starvation is the primary strategy used to induce oil accumulation in oleaginous yeast as part of a global stress response. While research has demonstrated that post-translational modifications (PTMs), including phosphorylation and protein cysteine thiol oxidation (redox PTMs), are involved in signaling pathways that regulate stress responses in metazoa and algae, their role in oleaginous yeast remain understudied and unexplored.
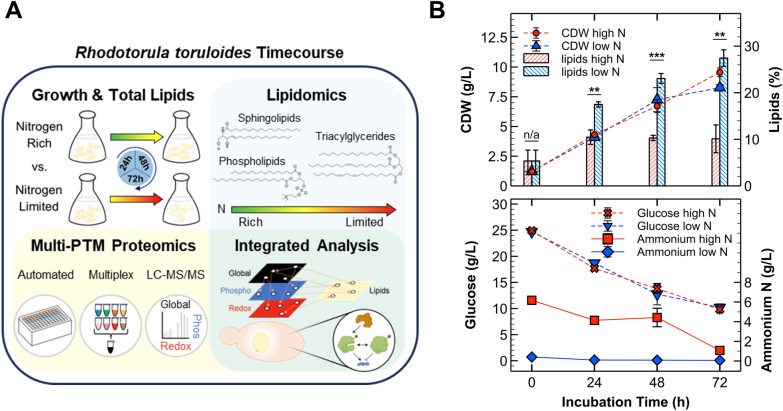
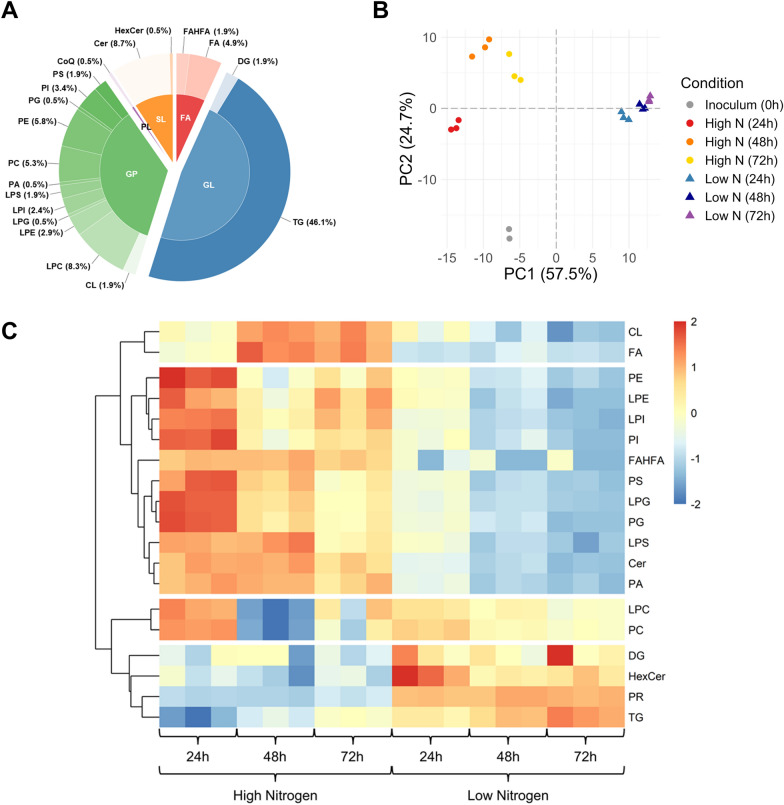
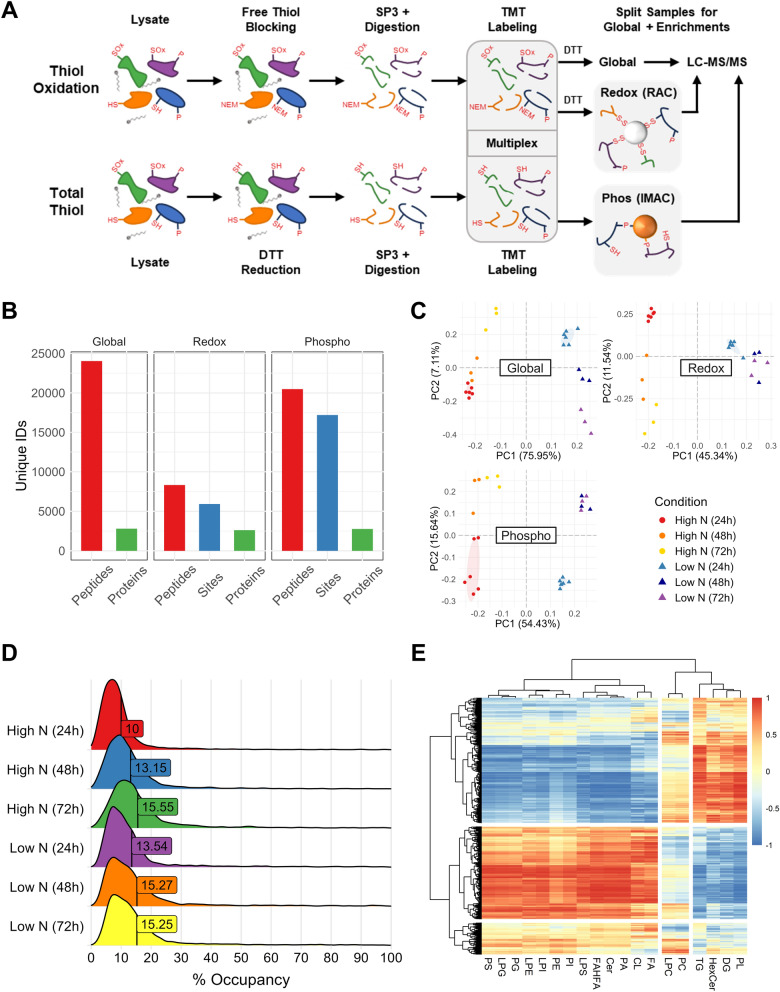
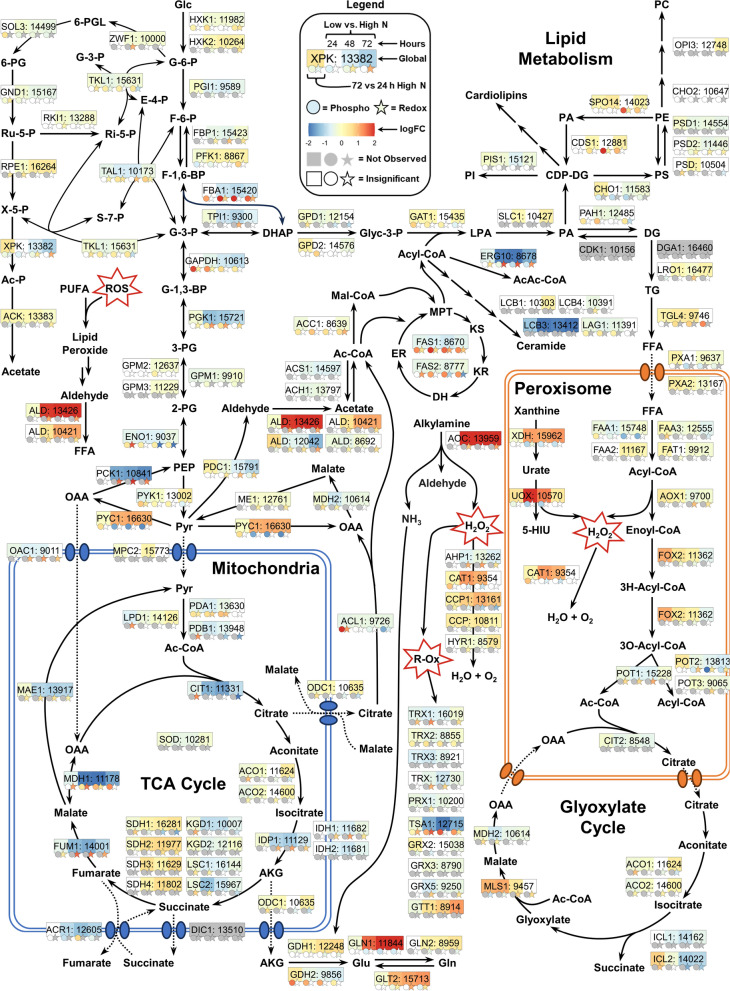
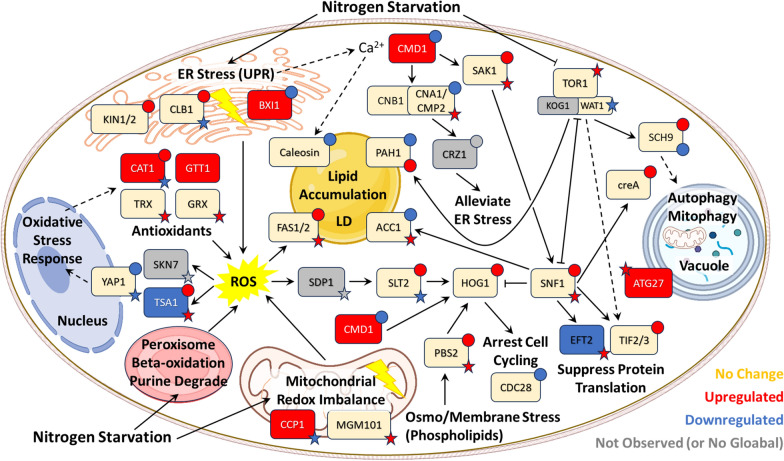
Results: Towards linking the yeast oleaginous phenotype to protein function, we integrated lipidomics, redox proteomics, and phosphoproteomics to investigate Rhodotorula toruloides under nitrogen-rich and starved conditions over time. Our lipidomics results unearthed interactions involving sphingolipids and cardiolipins with ER stress and mitophagy. Our redox and phosphoproteomics data highlighted the roles of the AMPK, TOR, and calcium signaling pathways in regulation of lipogenesis, autophagy, and oxidative stress response. As a first, we also demonstrated that lipogenic enzymes including fatty acid synthase are modified as a consequence of shifts in cellular redox states due to nutrient availability.
Conclusions: We conclude that lipid accumulation is largely a consequence of carbon rerouting and autophagy governed by changes to PTMs, and not increases in the abundance of enzymes involved in central carbon metabolism and fatty acid biosynthesis. Our systems-level approach sets the stage for acquiring multidimensional data sets for protein structural modeling and predicting the functional relevance of PTMs using Artificial Intelligence/Machine Learning (AI/ML). Coupled to those bioinformatics approaches, the putative PTM switches that we delineate will enable advanced metabolic engineering strategies to decouple lipid accumulation from nitrogen limitation.
© 2025. Battelle Memorial Institute and Austin Gluth, Bin Yang.
Conflict of interest statement
Declarations. Ethics approval and consent to participate: Not applicable. Consent for publication: All authors have agreed to the publication. Competing interests: The authors declare no competing interests.
Figures
Similar articles
-
Systematic analysis of the effects of splicing on the diversity of post-translational modifications in protein isoforms using PTM-POSE.bioRxiv [Preprint]. 2025 Mar 27:2024.01.10.575062. doi: 10.1101/2024.01.10.575062. bioRxiv. 2025. Update in: Cell Syst. 2025 Jul 16;16(7):101318. doi: 10.1016/j.cels.2025.101318. PMID: 38260432 Free PMC article. Updated. Preprint.
-
Management of urinary stones by experts in stone disease (ESD 2025).Arch Ital Urol Androl. 2025 Jun 30;97(2):14085. doi: 10.4081/aiua.2025.14085. Epub 2025 Jun 30. Arch Ital Urol Androl. 2025. PMID: 40583613 Review.
-
Signs and symptoms to determine if a patient presenting in primary care or hospital outpatient settings has COVID-19.Cochrane Database Syst Rev. 2022 May 20;5(5):CD013665. doi: 10.1002/14651858.CD013665.pub3. Cochrane Database Syst Rev. 2022. PMID: 35593186 Free PMC article.
-
Systemic Inflammatory Response Syndrome.2025 Jun 20. In: StatPearls [Internet]. Treasure Island (FL): StatPearls Publishing; 2025 Jan–. 2025 Jun 20. In: StatPearls [Internet]. Treasure Island (FL): StatPearls Publishing; 2025 Jan–. PMID: 31613449 Free Books & Documents.
-
Short-Term Memory Impairment.2024 Jun 8. In: StatPearls [Internet]. Treasure Island (FL): StatPearls Publishing; 2025 Jan–. 2024 Jun 8. In: StatPearls [Internet]. Treasure Island (FL): StatPearls Publishing; 2025 Jan–. PMID: 31424720 Free Books & Documents.
References
-
- Langholtz MH, Stokes BJ, Eaton LM. 2016 Billion-Ton Report: Advancing Domestic Resources for a Thriving Bioeconomy. EERE Publication and Product Library; 2016 Jul. Report No.: DOE/EE-1440. Available from: https://www.osti.gov/biblio/1271651-billion-ton-report-advancing-domesti...
-
- Ratledge C, Wynn JP. The Biochemistry and Molecular Biology of Lipid Accumulation in Oleaginous Microorganisms. In: Laskin AI, Bennett JW, Gadd GM, editors. Advances in Applied Microbiology. San Diego: Academic Press; 2002. p. 1–52. - PubMed
-
- Samranrit T, Teeka J, Ngernsombat K, Chiu C-H, Kaewpa D, Areesirisuk A. Modulation of yeast oil production by Pseudozyma parantarctica CHC28 using xylose and organic acids and its conversion feasibility to bio-polyurethane foam. Biochem Eng J. 2023;198: 109025.
LinkOut - more resources
Full Text Sources
Research Materials
Miscellaneous