. 2025 Jul 21;23(1):533.
doi: 10.1186/s12951-025-03599-1.

Metal-organic nanostructures based on sono/chemo-nanodynamic synergy of TixOy/Ru reaction units: for ultrasound-induced dynamic cancer therapy

Affiliations

Metal-organic nanostructures based on sono/chemo-nanodynamic synergy of TixOy/Ru reaction units: for ultrasound-induced dynamic cancer therapy

Tao Jiang et al. J Nanobiotechnology. .

Abstract

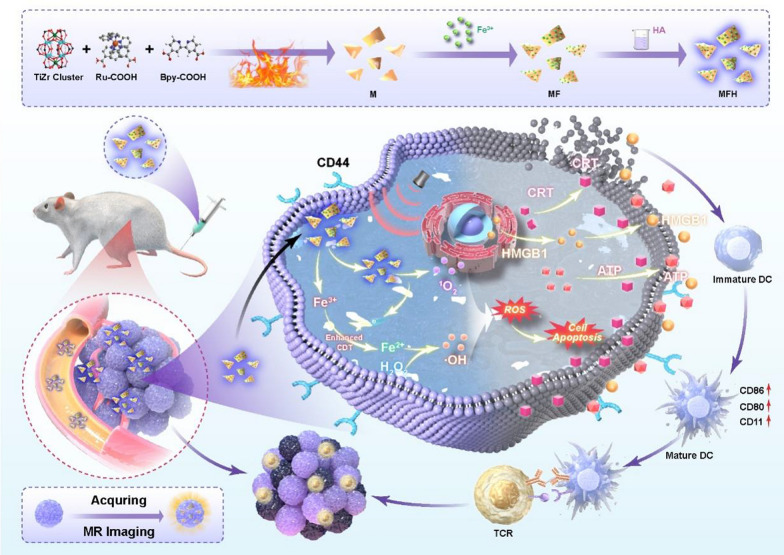
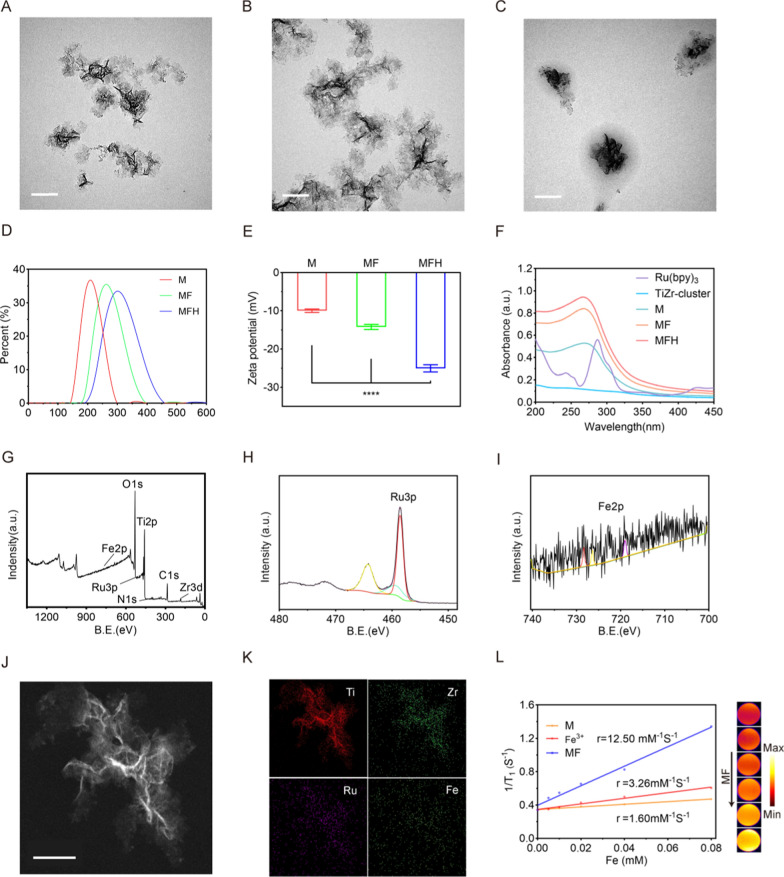
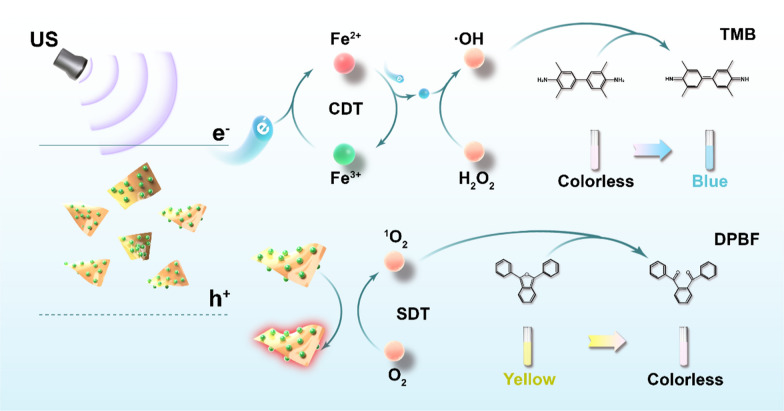
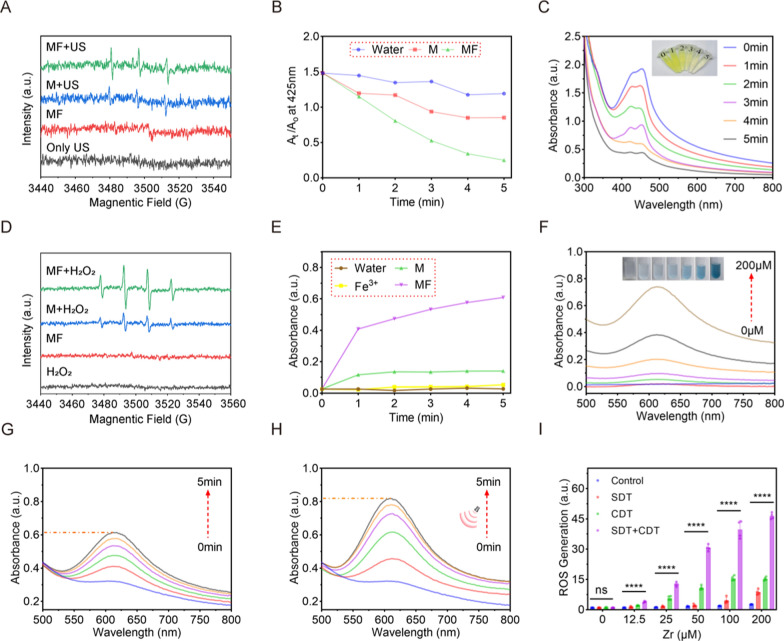
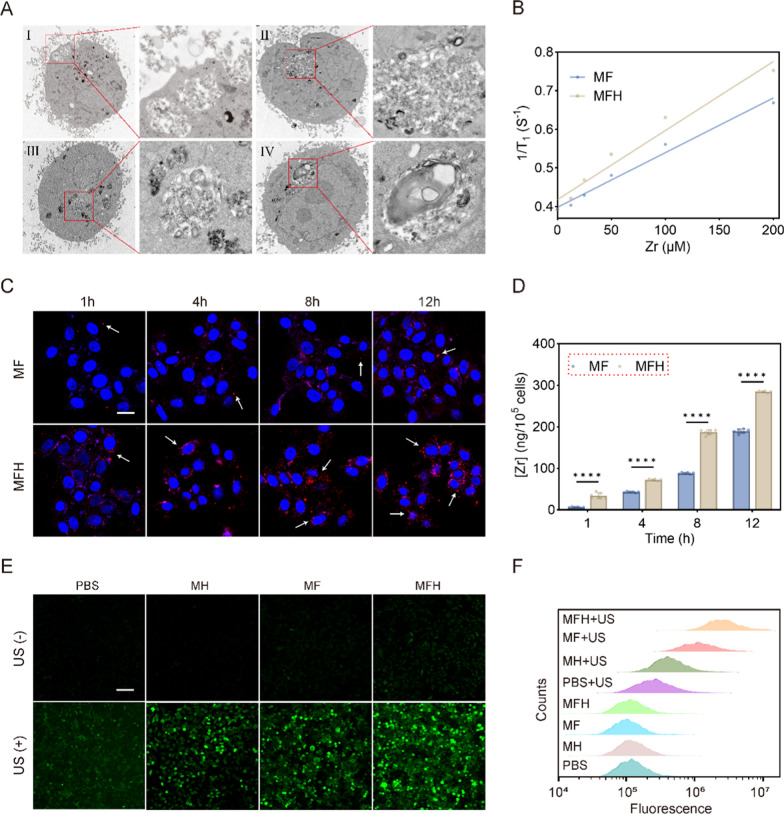
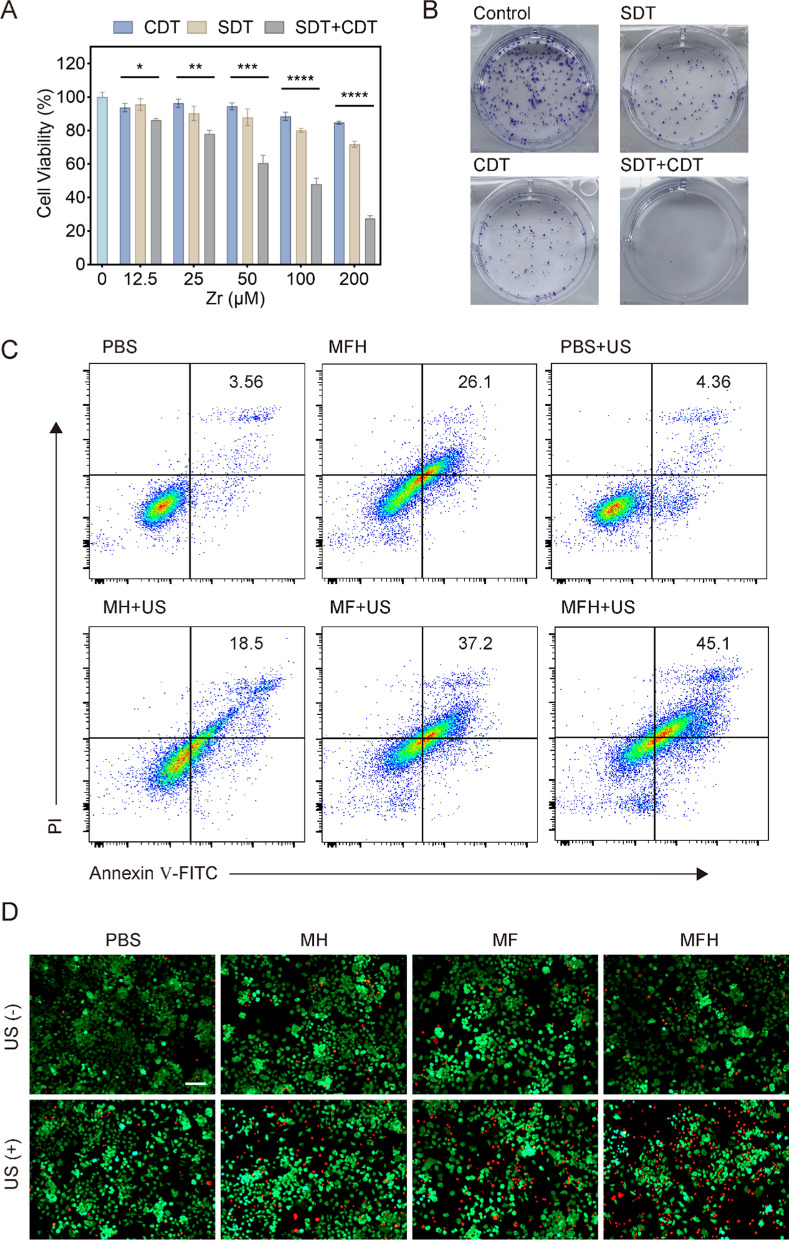
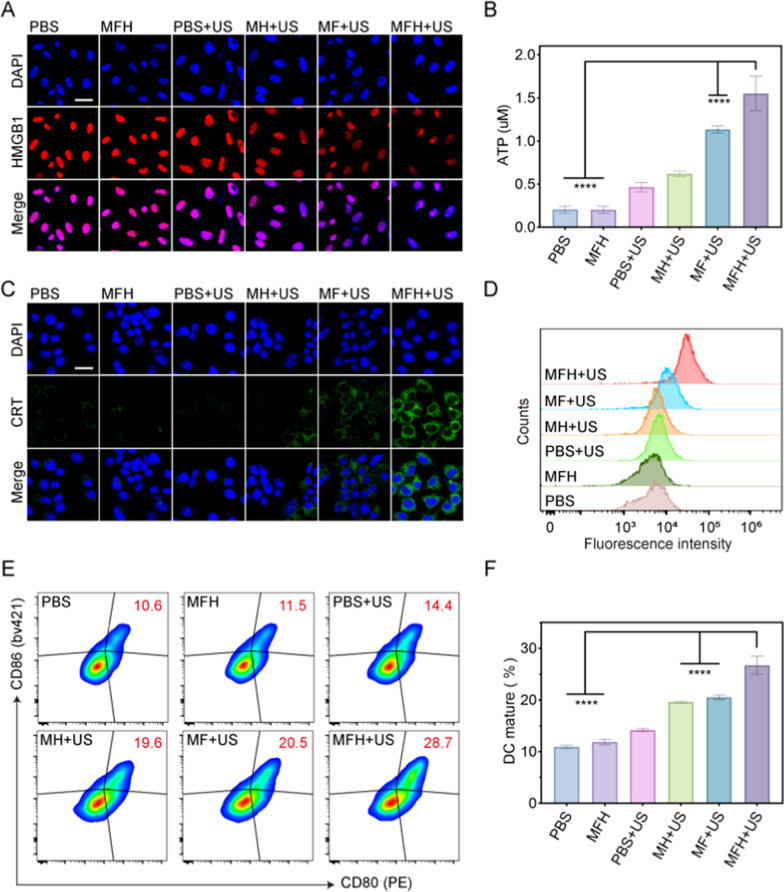
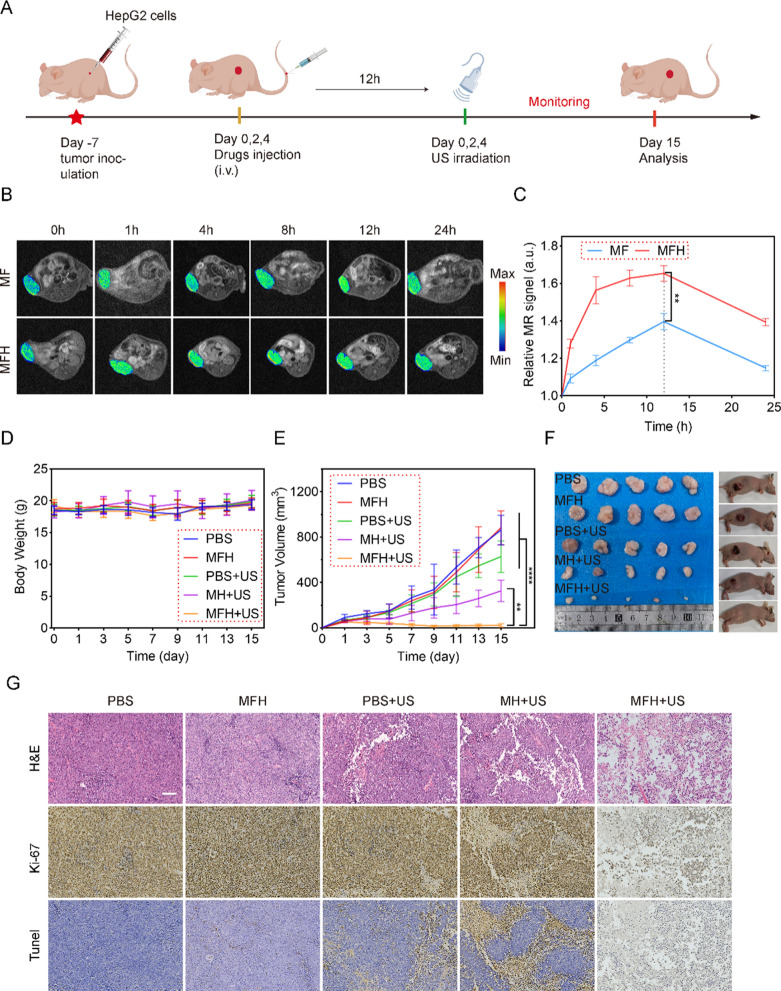
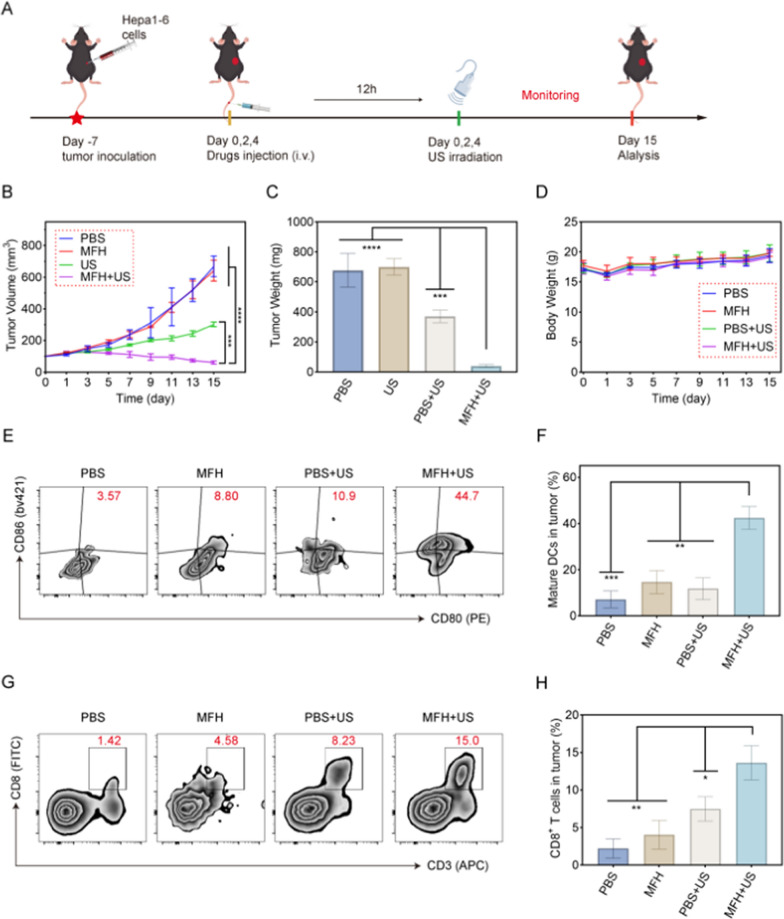
Sonodynamic therapy (SDT) exhibits clinical potential for deep-tissue tumor treatment due to its deep tissue penetration and spatiotemporal controllability. Its core mechanism relies on ultrasound-activated sonosensitizers to generate reactive oxygen species (ROS), thereby inducing tumor cell apoptosis. However, conventional sonosensitizers face limitations in ROS yield and tumor-targeting efficiency. In this study, we innovatively designed a multifunctional metal-organic nanosheet (TiZrRu-MON) by hydrothermal coordination of [Ru(bpy)₃]2⁺ photosensitizing units with TiZr-O clusters, while incorporating Fe3⁺ to construct a cascade catalytic system. Experimental results demonstrated that: (1) Fe3⁺ lattice doping significantly enhanced charge carrier mobility and ultrasound-triggered 1O₂ quantum yield via the formation charge transfer channels; (2) The acidic tumor microenvironment activated Fe3⁺-mediated Fenton reactions, establishing a positive feedback loop with SDT to synergistically amplify ROS generation; (3) Hyaluronic acid functionalization improved nanosheet internalization in HepG2 tumor cells through CD44 receptor-mediated endocytosis. Remarkably, ultrasound irradiation induced substantial oxidative stress and immunogenic cell death, promoting the release of damage-associated molecular patterns (DAMPs), which elevated the maturation rate of tumor-infiltrating dendritic cells (DCs) and significantly increased the proportion of CD8⁺ T cells. In a mouse subcutaneous tumor model, the system achieved effective tumor suppression with manageable systemic toxicity. This work proposes a metal-ligand coordination strategy to advance the development of high-performance sonosensitizers and immunomodulatory antitumor technologies.

Keywords: Cancer therapy; Chemodynamic therapy; Magnetic resonance imaging; Metal–organic nanostructure; Sonodynamic therapy.


Conflict of interest statement

Declarations. Ethics approval and consent to participate: All the animals were raised at Animal Care and Use Committee of Xiamen University (Ethics number XMULAC20190146). Consent for publication: Not applicable. Competing interests: The authors declare no competing interests.

Figures

Scheme 1
Scheme 1
Schematic illustration of TiZrRuFe-MON@HA (MFH) and synergistic inhibitory mechanism of sono/chemo-dynamic therapies for HCC. Schematic diagram of the synthetic process of MFH by hydrothermal-chelation-coating method. Synergetic-enhanced ROS generation of MFH for sono/chemo-dynamic therapeutic process under US irradiation against HCC. Under US irradiation, MF is activated, leading to the separation of e/h, which react with O₂ to generate 1O₂. Additionally, Fe2⁺ reacts with H₂O₂ to produce •OH and Fe3⁺, which is subsequently reduced back to Fe2⁺ by e⁻, forming a Fe3⁺/Fe2⁺ cycle (CDT). The synergistic effects of SDT and CDT demonstrate potent anti-tumor efficacy
Fig. 1
Fig. 1
a TEM of TiZrRu-MON (M) (Scale bars: 200 nm), b TiZrRuFe-MON (MF) (Scale bars: 200 nm), c TiZrRuFe-MON@HA (MFH) (Scale bars: 200 nm). d Average size and e Zeta potential of M, MF and MFH. f UV–Vis absorption of the TiZr-cluster, Ru-COOH, M, MF and MFH. g, h, i XPS spectra of MF. h Ru 3p, i Fe 2p. j HAADF image and k EDS elemental mapping images of MF (Scale bars: 100 nm). l Relaxation intensity of M, Fe3⁺, and MF at different concentrations and T1-weighted MR images of MF
Scheme 2
Scheme 2
Schematic representation of the SDT mechanism of MF under US irradiation and ROS generation detected by the probes. The reaction of •OH with TMB induces a color transition of the solution from colorless to blue, while the interaction of 1O₂ with DPBF results in a color change from yellow to colorless
Fig. 2
Fig. 2
a ESR signal of 1O₂ captured by TEMP. (US power density: 1.0 W/cm2, duty cycle: 50%, 5 min) b The SDT performance of DI water, M, and MF through changes in the UV–Vis absorption spectrum of DPBF. (US power density: 1.0 W/cm2, duty cycle: 50%, 5 min) c The SDT performance of MF under different US irradiation times using the UV–Vis absorption spectrum of DPBF. (US power density: 1.0 W/cm2, duty cycle: 50%, 5 min) d ESR signal of •OH captured by DMPO. (H₂O₂, 100 μM) e The CDT performance of DI water, Fe3⁺, M, and MF via the UV–Vis absorption spectrum of TMB. (H₂O₂, 100 μM) f The CDT performance of MF at different concentrations using the UV–Vis absorption spectrum of TMB. H₂O₂ (H₂O₂, 100 μM) g, h Evaluation of •OH generation by MF (Zr concentration, 100 μM) under no g or with h US conditions via TMB UV–Vis absorption spectroscopy. (H₂O₂, 100 μM) i Measurement of ROS levels in cells from different treatment groups. a Control, b SDT, c CDT, d SDT + CDT. (H₂O₂, 100 μM; US power density: 1.0 W/cm2, duty cycle: 50%, 5 min) *p < 0.05, **p < 0.01, ***p < 0.001, ****p < 0.0001; ns = not significant
Fig. 3
Fig. 3
a TEM image of HepG2 cells co-cultured with MFH. b HepG2 cells were analyzed by 1.5 T MR scanning after uptake of MF or MFH. c Cellular uptake of rhodamine B-labeled MF and MFH were assessed via fluorescence microscopy after 1, 4, 8, and 12 h (Scale bars: 20 μm). d Zr concentration analysis after cellular uptake of MF or MFH after 1, 4, 8, and 12 h. e CLSM images of HepG2 cells after different treatments to detect the production of ROS labeled by DCFH-DA. (Scale bars: 100 μm). (US power density: 1.0 W/cm2, duty cycle: 50%, 5 min). (F) Flow cytometric profiles of ROS generation. *p < 0.05, **p < 0.01, ***p < 0.001, ****p < 0.0001; ns = not significant
Fig. 4
Fig. 4
a The viability of HepG2 cells from different treatment groups. a SDT, b CDT, c SDT + CDT. b Colony formation assays of different treatments. a Control, b SDT, c CDT, d SDT + CDT. c Apoptosis analysis of HepG2 cells post-treatment via flow cytometry using Annexin V-FITC/PI dual staining. d Live/dead fluorescence imaging of HepG2 cells after different treatments, stained with calcein-AM (green, live) and PI (red, dead) (Scale bars: 100 μm). *p < 0.05, **p < 0.01, ***p < 0.001, ****p < 0.0001; ns = not significant
Fig. 5
Fig. 5
MFH + US elicited enhanced ICD and promoted DC maturation in vitro. a Representative CLSM images showing the remanent of HMGB1 from Hepa1-6 cells. Scale bar = 20 μm. b Extracellular ATP levels in Hepa1-6 cells post-treatments (n = 3). c Representative CLSM images showing the CRT surface exposure on Hepa1-6 cells. Scale bar = 20 μm. d FCM analysis of CRT expression on Hepa1-6 cell surfaces. e, f Semi-quantitative assessment of BMDCs maturation following co-culture with differentially pretreated Hepa1-6 cells, analyzed by FCM (n = 3). *p < 0.05, **p < 0.01, ***p < 0.001, ****p < 0.0001; ns = not significant
Fig. 6
Fig. 6
Biodistribution and therapeutic efficacy of MFH + US in HepG2 tumor-bearing nude mice. a Schematic of tumor modeling and therapeutic protocol (US: 1.0 W/cm2, 50% duty cycle, 5 min). b, c In vivo MR imaging of subcutaneous tumors following i.v. injection of MF/MFH at indicated timepoints (0–24 h). d Body weight changes and e Tumor growth curves post-treatments. f Excised tumor photographs. g Histological analysis: H&E, Ki-67 and TUNEL immunohistochemistry (Scale bar = 100 μm). *p < 0.05, **p < 0.01, ***p < 0.001, ****p < 0.0001; ns = not significant
Fig. 7
Fig. 7
MFH + US enhanced sonodynamic immunotherapy in Hepa1-6 subcutaneous tumors. a Schematic of tumor modeling and therapeutic protocol (US: 1.0 W/cm2, 50% duty cycle, 5 min). b Tumor growth curves and c weights across groups. d Body weight monitoring. e, f FCM analysis of tumor-infiltrating mature DCs (CD80⁺CD86⁺): e representative plots and f quantification. (n = 3) g, h FCM analysis of tumor-infiltrating CD8⁺ T-cell (CD3⁺CD8⁺): g representative plots and h quantification (n = 3). *p < 0.05, **p < 0.01, ***p < 0.001, ****p < 0.0001; ns = not significant

Similar articles

References

    1. Bray F, Laversanne M, Sung H, Ferlay J, Siegel RL, Soerjomataram I, et al. Global cancer statistics 2022: GLOBOCAN estimates of incidence and mortality worldwide for 36 cancers in 185 countries. CA A Cancer J Clin. 2024;74(3):229–63. - PubMed
    1. Frick C, Rumgay H, Vignat J, Ginsburg O, Nolte E, Bray F, et al. Quantitative estimates of preventable and treatable deaths from 36 cancers worldwide: a population-based study. Lancet Glob Health. 2023;11(11):e1700–12. - PMC - PubMed
    1. Raju GSR, Dariya B, Mungamuri SK, Chalikonda G, Kang SM, Khan IN, et al. Nanomaterials multifunctional behavior for enlightened cancer therapeutics. Semin Cancer Biol. 2021;69:178–89. - PubMed
    1. Gong Z, Dai Z. Design and challenges of sonodynamic therapy system for cancer theranostics: from equipment to sensitizers. Adv Sci (Weinheim, Baden-Wurttemberg, Germany). 2021;8(10):2002178. - PMC - PubMed
    1. Cheng P, Ming S, Cao W, Wu J, Tian Q, Zhu J, et al. Recent advances in sonodynamic therapy strategies for pancreatic cancer. Wiley Interdiscipl Rev Nanomed Nanobiotechnol. 2024;16(1): e1945. - PubMed