. 2025 Jul 21;16(1):394.
doi: 10.1186/s13287-025-04479-z.

Therapeutic impact of human trophoblast stem cells in peritoneal and pneumonia-induced sepsis in mice

Affiliations

Therapeutic impact of human trophoblast stem cells in peritoneal and pneumonia-induced sepsis in mice

Narae Hwang et al. Stem Cell Res Ther. .

Abstract

Background: Sepsis is a complex and life-threatening disease process related to a systemic response to severe infection. Due to the challenges of treating patients with sepsis, new therapies are being investigated, including cell-based approaches. Trophoblast stem cells (TSCs) are immune privileged cells with immunomodulatory properties. Thus, we proposed that TSCs may be beneficial in experimental models of sepsis to regulate the immune response and curtail organ injury.

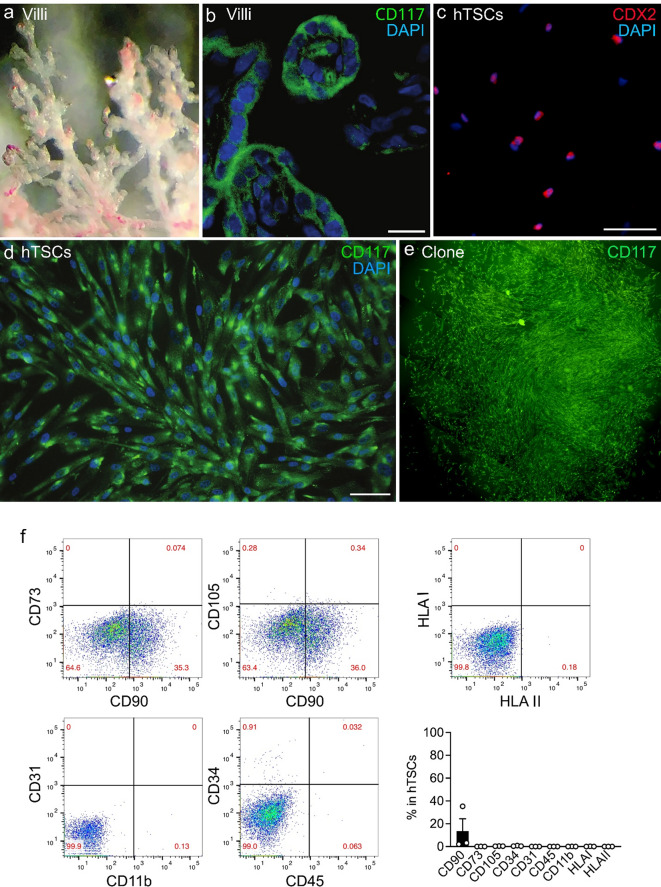
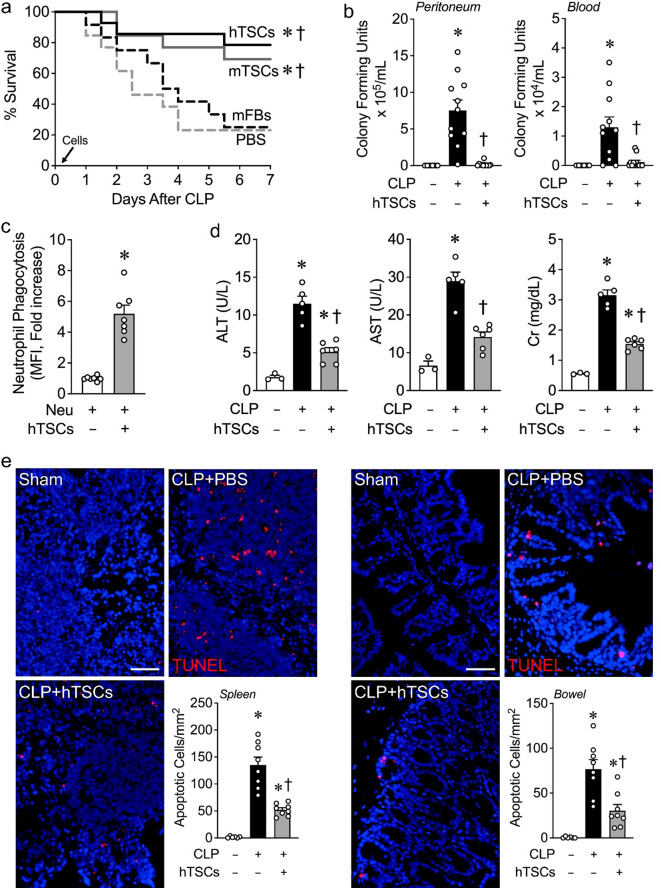
Methods: Sepsis was induced by experimental models in mice; cecal ligation and puncture (CLP) and lung infection with Streptococcus (S.) pneumoniae. TSCs were isolated from the chorionic villi of human (h) term placentas, and from mouse (m) placentas using anti-CD117 MicroBeads, and were administered intravenously 6 h after CLP or S. pneumoniae infection. We assessed mortality, bacterial clearance, organ injury, inflammatory response, and production of cytokines and chemokines.

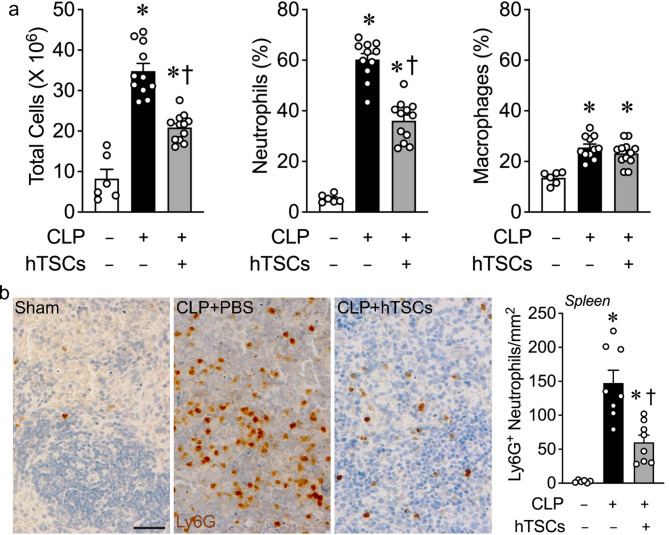
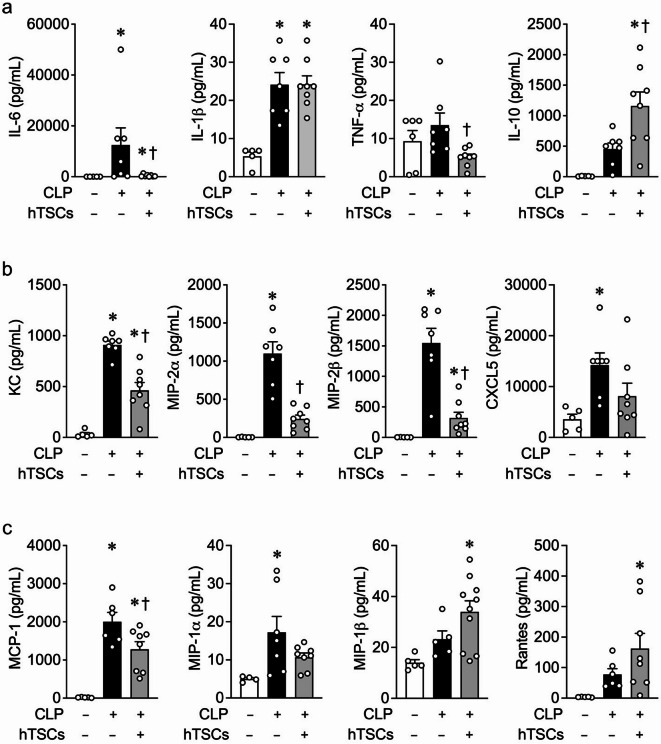
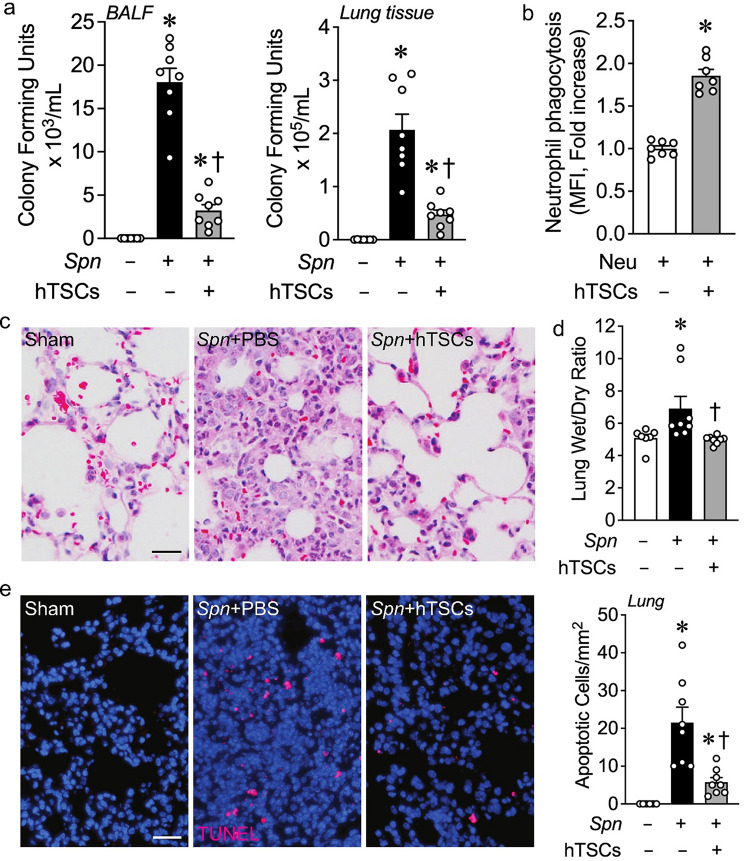
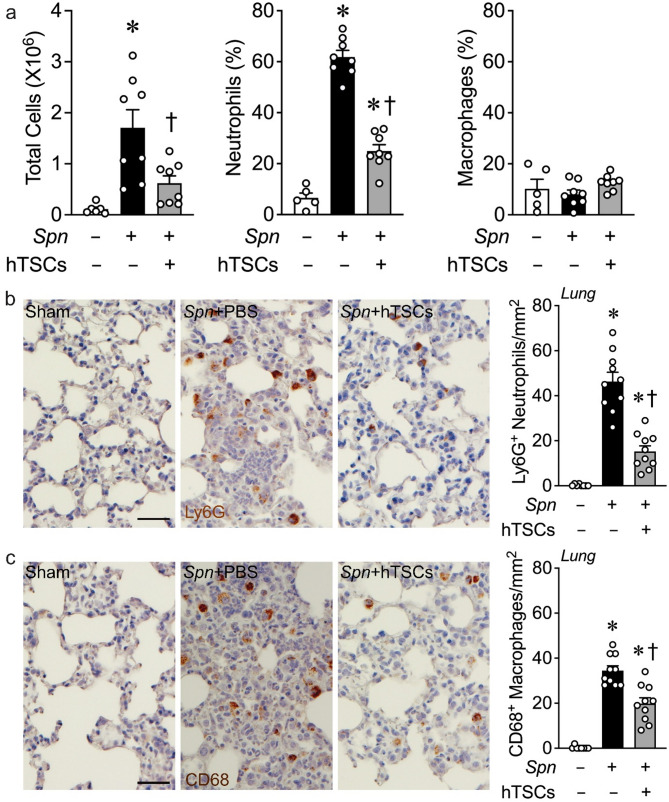
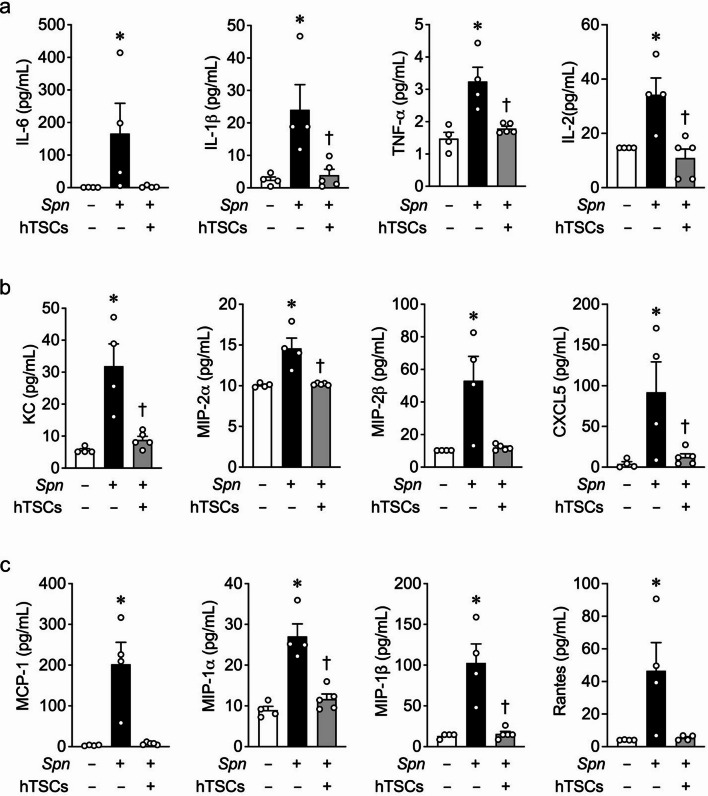
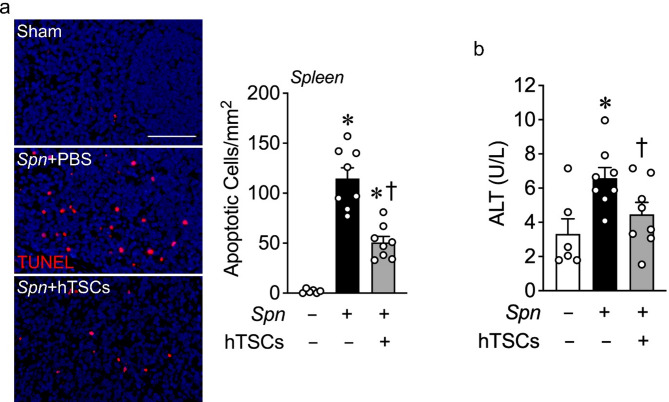
Results: CD117+ hTSCs did not express human leukocyte antigen (HLA) I or II, and were clonogenic and self-renewing. CLP led to severe mortality by 7 days, and administration of either hTSCs or mTSCs resulted in markedly improved survival compared with control cells or vehicle. hTSCs promoted bacterial clearance and decreased organ injury in the liver, kidney, spleen, and bowel. The elevated innate immune response in the peritoneum, predominantly neutrophils, was attenuated by hTSCs. In addition, neutrophil infiltration into the spleen was less in mice receiving hTSCs, which corresponded with reduced plasma pro-inflammatory cytokines and chemokines. When assessing the lung response to S. pneumoniae infection, administration of hTSCs resulted in fewer bacteria in bronchoalveolar lavage fluid (BALF) and lung tissue, and less lung edema and injury. Neutrophils, which were markedly increased in BALF, were diminished and infiltration of neutrophils and macrophages into the lungs was decreased by hTSCs. BALF pro-inflammatory cytokines and chemokines were mitigated by hTSCs to levels of Sham mice, and systemic injury to the liver and spleen was attenuated.

Conclusions: CD117+ hTSCs are immune privileged cells that when given after the onset of experimental models of infection/sepsis resulted in improved outcomes due to enhanced bacterial clearance, resolving inflammation, and less organ injury. These data support hTSCs as a potential cell-based therapy for sepsis.

Keywords: Acute organ injury; Bacterial clearance; Inflammation; Sepsis; Trophoblast stem cells.


Conflict of interest statement

Declarations. Ethics approval and consent to participate: Human Cells: The trophoblast stem cells were harvested from human term placental tissue. All of the tissue was from discarded placental specimens, de-identified prior to collection by the research team. Thus, the study was considered to be Not Human Subjects Research by the Brigham and Women’s Hospital Institutional Review Board (Record ID 1830). Animal Ethics declaration: Studies using mice were carried out in accordance with the Public Health Service policy on the humane care and use of laboratory animals, and approved by the Institutional Animal Care and Use Committee (IACUC) of Brigham and Women’s Hospital (Protocol 2016N000308). As per our IACUC protocol, with major surgical procedures, analgesics were used. Moreover, the use of humane endpoints was applied during the survival experiments in the CLP model of sepsis. Consent for publication: Not applicable. Competing interests: The authors declare no competing interests.

Figures

Fig. 1
Fig. 1
Characterization of CD117+ hTSCs in vitro. (a) Representative image of human placental chorionic villi. (b) Chorionic villi stained positive for CD117 (green), DAPI for nuclear staining (blue). Scale bar presents 10 μm. (c & d) hTSCs isolated from the villi express CDX2 (red, c), a marker for trophoblast stem cells, and CD117 (green, d), DAPI for nuclear staining (blue). Scale bars present 50 μm. (e) A hTSC clone stained positive for CD117 in limited dilution culture. Multiple images stitched. (f) Representative scatter plots of flow cytometer for CD73 versus CD90 (upper left panel), CD105 versus CD90 (upper middle panel), CD31 versus CD11b (lower left panel) and CD34 versus CD45 (lower right panel). HLA I versus HLA II (upper right panel). Quantitation of the flow cytometric assay in the bar graph show percentage of markers for MSCs (CD90, CD73, CD105) and hematopoietic cells (CD34, CD31, CD45 and CD11b), and HLA I (HLA-A, HLA-B and HLA-C) and HLA II (HLA II: HLA-DR, HLA-DP and HLA-DQ) in the total hTSC population, n = 3 for each marker
Fig. 2
Fig. 2
hTSCs promote survival and decrease tissue injury during CLP-induced sepsis. (a) Animal survival assay. C57BL/6 mice were subjected to CLP and 6 h later, randomly assigned to receive PBS (n = 13), mFBs (n = 12), mTSCs (n = 13) and hTSCs (n = 14). A 5 × 105 cells suspension in 200 µL PBS or PBS was injection via the tail vein. Animal survival was monitored for 7 days, and data are presented as a Kaplan-Meier survival curve. Log-rank test. P = 0.0023, overall; P ≤ 0.0270 * vs. mFBs, † vs. PBS. No significant difference hTSCs vs. mTSCs, and mFBs vs. PBS. (b) Bacterial counts of peritoneal lavage (left panel) and blood (right panel) 24 h after Sham or CLP surgery. Mice were subjected to Sham and received PBS (CLP-hTSCs-) or CLP surgery (CLP+) and received PBS (CLP + hTSCs-) or hTSCs (CLP + hTSCs+), n = 6–12 per group. Data are presented as mean ± SEM. Kruskal-Wallis test. P ≤ 0.0183, * vs. Sham, † vs. CLP + PBS (hTSCs-). (c) Phagocytosis of neutrophils. Activated peritoneal neutrophils were incubated with GFP-labeled E.coli in the presence of no hTSCs (-) or hTSCs (+) in vitro, n = 7 in each group. Data are presented as mean±SEM. Student’s unpaired t test. P < 0.0001: * vs. hTSCs-. (d) Plasma levels of alanine transaminase (ALT, left panel), aspartate aminotransferase (AST, middle panel), and creatinine (Cr, right panel) were assessed at 24 h after surgery, n = 3–6 per group. Data are presented as mean±SEM. One-way ANOVA with Tukey’s post hoc test. P ≤ 0.00372, * vs. Sham, † vs. CLP + PBS (hTSCs-). (e) Spleen and bowel harvested at 24 h after surgery and immunostaining for TUNEL. Scale bars represent 50 μm. TUNEL quantitation shows in bar graphs, n = 6–8 per group. Data are presented as mean±SEM. One-way ANOVA with Tukey’s post hoc test. P ≤ 0.0469: * vs. Sham (CLP-), † vs. CLP + PBS (hTSCs-)
Fig. 3
Fig. 3
hTSCs attenuate the inflammation response during CLP-induced sepsis. Sham and CLP surgeries were performed on mice, and 6 h later, Sham mice received PBS (CLP-hTSCs-) and CLP mice received PBS (CLP + hTSCs-), or TSCs (CLP + hTSCs+). Peritoneal fluid and spleens were collected at 24 h after surgery. (a) Total cell number by counting (left panel), percentage of neutrophils (middle panel) and macrophages (right panel) by flow cytometry assay, in peritoneal fluid, n = 6–12 per group. Data are presented as mean±SEM. One-way ANOVA with Tukey’s post hoc test. P ≤ 0.0003: * vs. Sham (CLP-), † vs. CLP + PBS (hTSCs-). (b) The spleen immunostaining for Ly6G, Scale bar represents 50 μm. The quantitation shows in bar graph, n = 6–8 per group. Data are presented as mean±SEM. One-way ANOVA with Tukey’s post hoc test. P ≤ 0.0235: * vs. Sham (CLP-), † vs. CLP + PBS (hTSCs-)
Fig. 4
Fig. 4
hTSCs regulate systemic inflammatory cytokines and chemokines during CLP-induced sepsis. Luminex assay of plasma from mice 24 h after Sham (CLP-) or CLP surgery (+), received PBS (hTSCs-) or hTSCs (+). Plasma levels of (a) pro- and anti-inflammatory cytokines (IL-6, IL-1β, TNF-α and IL-10). (b) neutrophil chemokines (KC, MIP-2α, MIP-2β, and CXCL5). (c) macrophage chemokines (MCP-1, MIP-1α, MIP-1β, and Rantes). Data are presented as mean±SEM. One-way ANOVA with Tukey’s post hoc test was performed for IL-1β, TNF-α, IL-10, KC, MIP-2α, MIP-1α, MIP-1β, MCP-1, and Rantes. Kruskal-Wallis test was performed for IL-6, MIP-2β, and CXCL5. n = 4–8 per group,P ≤ 0.0479 for (a); n = 5–10 per group, P ≤ 0.0003 for (b); n = 4–10 per group, P ≤ 0.0404 for (c). * vs. Sham (CLP-), † vs. CLP + PBS (hTSCs-)
Fig. 5
Fig. 5
hTSCs promote bacterial clearance and protect tissue from injury during S. pneumoniae (Spn)-induced pneumonia. C57BL/6 mice received intranasal inoculation of PBS (Spn-, Sham) or S. pneumoniae (Spn+), and 6 h later, the mice were treated with PBS (hTSCs-) or hTSCs (+) by tail vein injection. BALF and lung tissues were collected at 72 h after the procedure. (a) Bacterial counts (CFUs) in BALF (left panel) and lung tissue (right panel), n = 7–8 per group. Data are presented as mean±SEM. Kruskal-Wallis test. P ≤ 0.0318, * vs. Sham (Spn-), † vs. Spn + PBS (hTSCs-). (b) Phagocytosis of Spn by neutrophils. Activated peritoneal neutrophils were incubated with FITC-labeled Spn in the presence of no hTSCs (-) or hTSCs (+) in vitro, and flow cytometry was performed. Data are presented as mean±SEM, n = 7 per group. Student’s unpaired t test. * P < 0.0001 vs. absence of hTSCs (-); (c) Representative images of H&E staining of the lungs. Scale bar presents 50 μm. (d) Wet to dry weight ratio, an index of pulmonary edema, n = 7–8 per group. Data are presented as means±SEM. Kruskal-Wallis test. P ≤ 0.0105, * vs. Sham (Spn-), † vs. Spn + PBS (hTSCs-); (e) Representative image of lung staining for TUNEL, Scale bar presents 50 μm. The quantitation shows in bar graph, n = 6–8 per group. Data are presented as mean±SEM. Kruskal-Wallis test. P ≤ 0.0011, * vs. Sham (Spn-), † vs. Spn + PBS (hTSCs-)
Fig. 6
Fig. 6
hTSCs reduce the lung inflammatory response during S. pneumoniae (Spn)-induced pneumonia. Mice received intranasal inoculation of PBS (Spn-, Sham) or S. pneumoniae (Spn+), and were treated with PBS (hTSCs-) or hTSCs (+) by tail vein injection, 6 h after procedure. BALF and lung tissues were collected at 72 h after lung infection. (a) Total cell number by counting (left panel), percentage of neutrophils (middle panel) and macrophages (right panel) by flow cytometry assay in BALF, n = 5–8 per group. Data are presented as mean±SEM. One-way ANOVA with Tukey’s post hoc test. P ≤ 0.0103: * vs. Sham (Spn-), † vs. Spn + PBS (hTSCs-); (b-c) Representative images of lung immunostaining for Ly6G (neutrophils, b) and CD68 (macrophages, c). Scale bar represents 50 μm. Quantification is shown in the bar graphs, n = 8–10 per group. Data are presented as mean±SEM. One-way ANOVA with Tukey’s post hoc test. P ≤ 0.005, * vs. Sham (Spn-), † vs. Spn + PBS (hTSCs-)
Fig. 7
Fig. 7
hTSCs regulate inflammatory cytokines and chemokines in BALF during S. pneumoniae (Spn)-induced pneumonia. Luminex assay of BALF from mice 72 h after inoculation with PBS (Sham) or Spn, received PBS (hTSCs-) or hTSCs (+). (a) pro-inflammatory cytokines (IL-6, IL-1β, TNF-α and IL-2). (b) neutrophil chemokines (KC, MIP-2α, MIP-2β and CXCL5). (c) macrophages chemokines (MCP-1, MIP-1α, MIP-1β and Rantes). Data are presented as mean±SEM. One-way ANOVA with Tukey’s post hoc test was performed for TNF-α, IL-2, KC, CXCL5, and MIP-1α. Kruskal-Wallis test was performed for IL-6, IL-1β, MIP-2α, MIP-2β, MCP-1, MIP-1β, and Rantes. n = 4–5 per group, P ≤ 0.0464 for (a); n = 4–5 per group, P ≤ 0.0394 for (b); n = 4 per group, P ≤ 0.0417 for (c). * vs. Sham (Spn-), † vs. Spn + PBS (hTSCs-)
Fig. 8
Fig. 8
hTSCs decrease systemic organ injury during S. pneumoniae (Spn) lung infection. Lungs of mice were inoculated with PBS (Sham, Spn-) or Spn (+) and following by treatment of PBS (hTSCs-) or hTSCs (+) 6 h later. Plasma and spleen were harvested at 72 h after Spn lung infection. (a) Representative image of spleens staining for TUNEL. Scale bar represents 100 μm. Quantitative data is shown in the bar graph, n = 6–8 per group. Data are presented as mean±SEM. One-way ANOVA with Tukey’s post hoc test. P ≤ 0.001: * vs. Sham (Spn-), † vs. Spn + PBS (hTSCs-). (b) Alanine aminotransferase (ALT) activity in plasma was measured by a commercial assay kit (Abcam), n = 6–8 per group. Data are presented as mean ± SEM. One-way ANOVA with Tukey’s post hoc test. P ≤ 0.0455: * vs. Sham (Spn-), † vs. Spn + PBS (hTSCs-)

Similar articles

References

    1. Angus DC, Linde-Zwirble WT, Lidicker J, Clermont G, Carcillo J, Pinsky MR. Epidemiology of severe sepsis in the united states: analysis of incidence, outcome, and associated costs of care. Crit Care Med. 2001;29:1303–10. - PubMed
    1. Hotchkiss RS, Karl IE. The pathophysiology and treatment of sepsis. N Engl J Med. 2003;348:138–50. - PubMed
    1. Angus DC, van der Poll T. Severe sepsis and septic shock. N Engl J Med. 2013;369(9):840–51. - PubMed
    1. Fleischmann C, Scherag A, Adhikari NK, Hartog CS, Tsaganos T, Schlattmann P, et al. Assessment of global incidence and mortality of Hospital-treated sepsis. Current estimates and limitations. Am J Respir Crit Care Med. 2016;193(3):259–72. - PubMed
    1. Lagu T, Rothberg MB, Shieh MS, Pekow PS, Steingrub JS, Lindenauer PK. Hospitalizations, costs, and outcomes of severe sepsis in the united States 2003 to 2007. Crit Care Med. 2012;40(3):754–61. - PubMed

MeSH terms