

A comparison of modeling approaches for static and dynamic prediction of central-line bloodstream infections using electronic health records (part 1): regression models
- PMID: 40691628
- PMCID: PMC12278581
- DOI: 10.1186/s41512-025-00199-3
A comparison of modeling approaches for static and dynamic prediction of central-line bloodstream infections using electronic health records (part 1): regression models
Abstract
Background: Hospitals register information in the electronic health records (EHRs) continuously until discharge or death. As such, there is no censoring for in-hospital outcomes. We aimed to compare different static and dynamic regression modeling approaches to predict central line-associated bloodstream infections (CLABSIs) in EHR while accounting for competing events precluding CLABSI.
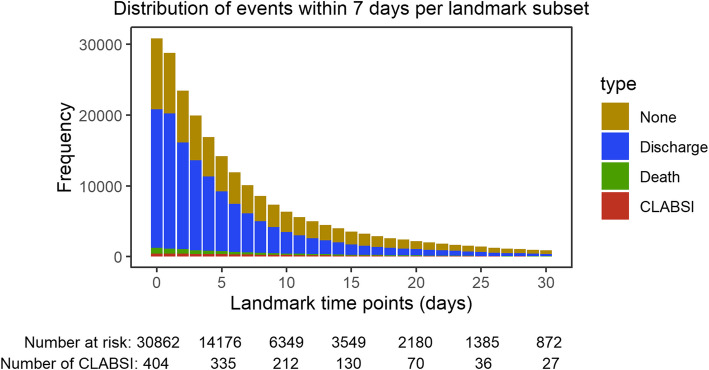
Methods: We analyzed data from 30,862 catheter episodes at University Hospitals Leuven from 2012 and 2013 to predict 7-day risk of CLABSI. Competing events are discharge and death. Static models using information at catheter onset included logistic, multinomial logistic, Cox, cause-specific hazard, and Fine-Gray regression. Dynamic models updated predictions daily up to 30 days after catheter onset (i.e., landmarks 0 to 30 days) and included landmark supermodel extensions of the static models, separate Fine-Gray models per landmark time, and regularized multi-task learning (RMTL). Model performance was assessed using 100 random 2:1 train-test splits.
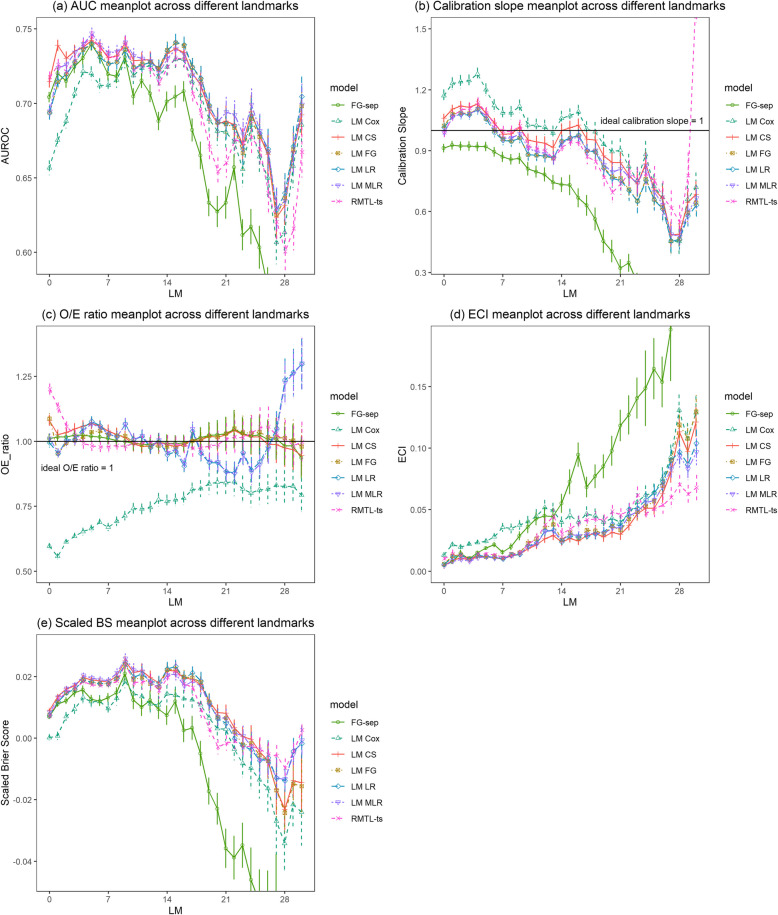
Results: The Cox model performed worst of all static models in terms of area under the receiver operating characteristic curve (AUROC) and calibration. Dynamic landmark supermodels reached peak AUROCs between 0.741 and 0.747 at landmark 5. The Cox landmark supermodel had the worst AUROCs (≤ 0.731) and calibration up to landmark 7. Separate Fine-Gray models per landmark performed worst for later landmarks, when the number of patients at risk was low.
Conclusions: Categorical and time-to-event approaches had similar performance in the static and dynamic settings, except Cox models. Ignoring competing risks caused problems for risk prediction in the time-to-event framework (Cox), but not in the categorical framework (logistic regression).
Keywords: Central line–associated bloodstream infection; Dynamic model; Logistic regression; Risk prediction; Survival analysis.
© 2025. The Author(s).
Conflict of interest statement
Declarations. Ethics approval and consent to participate: The study was approved by the Ethics Committee Research UZ/KU Leuven (EC Research, https://admin.kuleuven.be/raden/en/ethics-committee-research-uz-kuleuven#) on 19 January 2022 (S60891). The Ethics Committee Research UZ/KU Leuven waived the need to obtain informed consent from participants. All patient identifiers were coded using the pseudo-identifier in the data warehouse by the Management Information Reporting Department of UZ Leuven, according to the General Data Protection Regulation (GDPR). Competing interests: The authors declare that they have no conflicts of interests to disclose.
Figures

Similar articles
-
A comparison of modeling approaches for static and dynamic prediction of central line-associated bloodstream infections using electronic health records (part 2): random forest models.Diagn Progn Res. 2025 Jul 21;9(1):21. doi: 10.1186/s41512-025-00194-8. Diagn Progn Res. 2025. PMID: 40691852 Free PMC article.
-
Comparison of Two Modern Survival Prediction Tools, SORG-MLA and METSSS, in Patients With Symptomatic Long-bone Metastases Who Underwent Local Treatment With Surgery Followed by Radiotherapy and With Radiotherapy Alone.Clin Orthop Relat Res. 2024 Dec 1;482(12):2193-2208. doi: 10.1097/CORR.0000000000003185. Epub 2024 Jul 23. Clin Orthop Relat Res. 2024. PMID: 39051924
-
Ultrasound guidance versus anatomical landmarks for internal jugular vein catheterization.Cochrane Database Syst Rev. 2015 Jan 9;1(1):CD006962. doi: 10.1002/14651858.CD006962.pub2. Cochrane Database Syst Rev. 2015. PMID: 25575244 Free PMC article.
-
Impact of residual disease as a prognostic factor for survival in women with advanced epithelial ovarian cancer after primary surgery.Cochrane Database Syst Rev. 2022 Sep 26;9(9):CD015048. doi: 10.1002/14651858.CD015048.pub2. Cochrane Database Syst Rev. 2022. PMID: 36161421 Free PMC article.
-
Does the Presence of Missing Data Affect the Performance of the SORG Machine-learning Algorithm for Patients With Spinal Metastasis? Development of an Internet Application Algorithm.Clin Orthop Relat Res. 2024 Jan 1;482(1):143-157. doi: 10.1097/CORR.0000000000002706. Epub 2023 Jun 12. Clin Orthop Relat Res. 2024. PMID: 37306629 Free PMC article.
References
-
- Gao S, Albu E, Tuand K, et al. Systematic review finds risk of bias and applicability concerns for models predicting central line-associated bloodstream infection. J Clin Epidemiol. 2023Sep;161:127–39. - PubMed
Grants and funding
LinkOut - more resources
Full Text Sources
Research Materials