

Monitoring breast cancer progression through circulating methylated GCM2 and TMEM240 detection
- PMID: 40691650
- PMCID: PMC12281721
- DOI: 10.1186/s13148-025-01939-4
Monitoring breast cancer progression through circulating methylated GCM2 and TMEM240 detection
Abstract
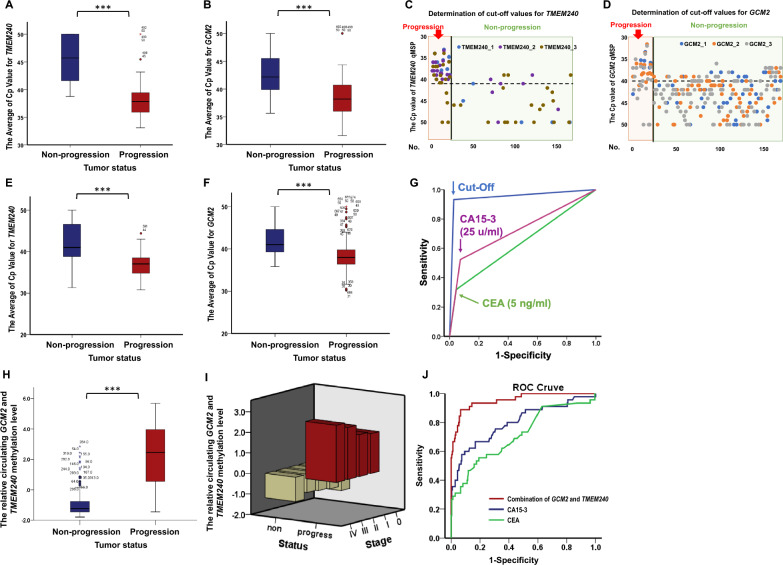
Background: Breast cancer is the most commonly diagnosed cancer and the second leading cause of cancer-related deaths in women worldwide. Approximately 20-30% of women diagnosed with early-stage breast cancer eventually develop metastatic disease. Current biomarkers, such as CA15-3 and CEA, detect metastasis in only 60-80% of cases, underscoring the need for improved diagnostic tools. This study investigates the potential of circulating methylated GCM2 and TMEM240 as biomarkers for noninvasive monitoring of breast cancer progression.
Methods: In a prospective study conducted in Taiwan, 396 patients were enrolled, alongside a retrospective study of 134 plasma samples from Western populations. cfDNA was extracted, subjected to sodium bisulfite conversion, and the methylation levels of GCM2 and TMEM240 were measured using QMSP. Monte Carlo analysis assigned 70% of the dataset to a training set and 30% to a validation set, repeated 1000 times. Performance metrics such as sensitivity, specificity, and accuracy were averaged to ensure robustness, supporting the use of combined GCM2 and TMEM240 for monitoring treatment response and tumor burden.
Results: The training set, consisting of 166 breast cancer patients (13.3% with recurrence or metastasis), was utilized to establish the biomarker detection cutoff. Validation in a separate cohort of 325 patients (20% with recurrence or metastasis) demonstrated superior performance compared to CA15-3 and CEA, achieving 95.1% accuracy, 89.4% sensitivity, 96.5% specificity, 86.8% positive predictive value (PPV), and 97.3% negative predictive value (NPV). Monte Carlo analysis of the training data revealed an average sensitivity of 95.7%, specificity of 90.3%, and accuracy of 91.5%, while validation data achieved 92.8% sensitivity, 89.5% specificity, and 90.3% accuracy across 1000 replicates. Positive cases were significantly associated with late-stage disease (P < 0.001), larger tumors (P = 0.002), distant metastasis (P < 0.001), and disease progression (P < 0.001). For monitoring treatment response and tumor burden, decreased methylation levels were observed in patients responding well to treatment, whereas increased levels were noted in cases of cancer progression or prior to metastasis.
Conclusions: Overall, detecting methylated GCM2 and TMEM240 in plasma offers a novel, accurate, and noninvasive method for monitoring breast cancer progression.
Keywords: GCM2; TMEM240; Breast cancer; Circulating cell-free DNA; Methylation biomarker.
© 2025. The Author(s).
Conflict of interest statement
Declarations. Ethics approval and consent to participate: The study has been approved by the Taipei Medical University—Joint Institutional Review Board and the Institutional Review Board. Written informed consent was obtained from all patients. Consent for publication: Not applicable. Competing interests: Part authors are employees of EG BioMed Co. Ltd. and EG BioMed US Inc., whose company funded this study. HTS, RKL are employees of EG BioMed Co. Ltd. and EG BioMed US Inc., HTS, CMS, CSH and RKL hold stock in EG BioMed Co. Ltd. and EG BioMed US Inc., and report other support from EG BioMed Co. Ltd. and EG BioMed US Inc., during the conduct of the study. In addition, RKL has multiple patents in the field of cancer detection pending to EG BioMed Co. Ltd. The remaining authors declare no competing interests.
Figures


References
-
- Taiwan Health Promotion Administration: Cancer Registry Annual Report, 2017. Taiwan: Ministry of Health and Welfare; 2019.
-
- Statistics on causes of death in China in 2017 [https://www.mohw.gov.tw/cp-16-48057-1.html]
-
- Bray F, Ferlay J, Soerjomataram I, Siegel RL, Torre LA, Jemal A. Global cancer statistics 2018: GLOBOCAN estimates of incidence and mortality worldwide for 36 cancers in 185 countries. CA Cancer J Clin. 2018;68:394–424. - PubMed
-
- Chaffer CL, Weinberg RA. A perspective on cancer cell metastasis. Science. 2011;331:1559–64. - PubMed
MeSH terms
Substances
LinkOut - more resources
Full Text Sources
Medical
