

Application of smart technologies for predicting soil erosion patterns
- PMID: 40691718
- PMCID: PMC12279979
- DOI: 10.1038/s41598-025-12125-0
Application of smart technologies for predicting soil erosion patterns
Abstract
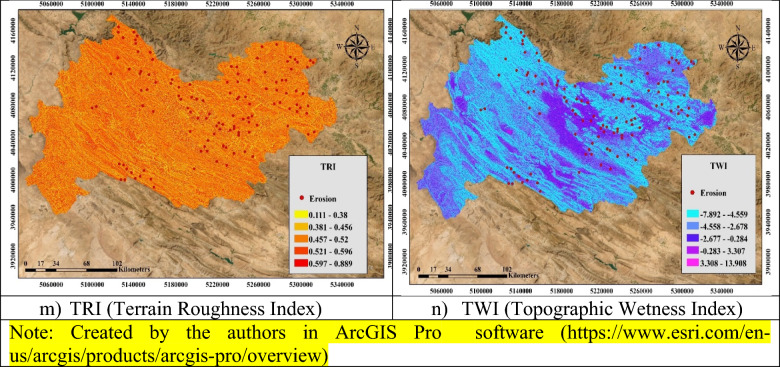
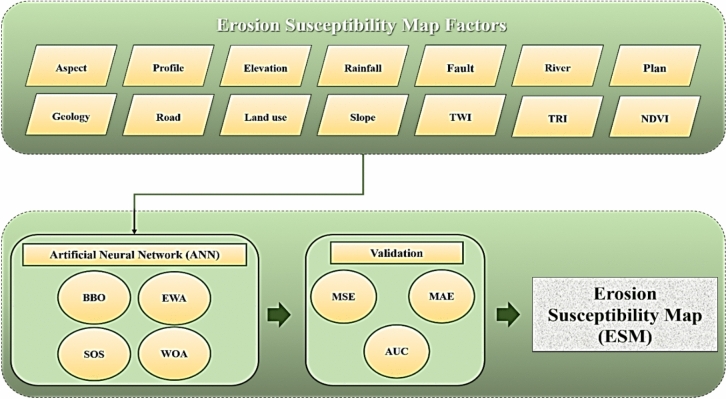
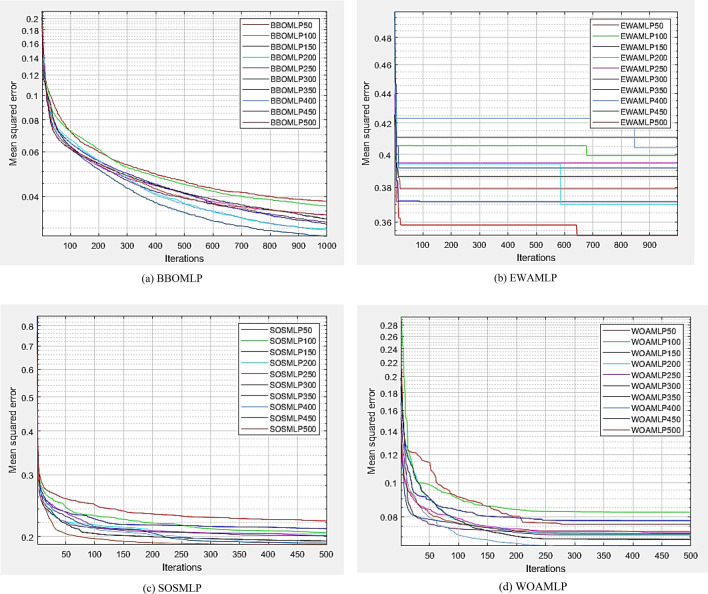
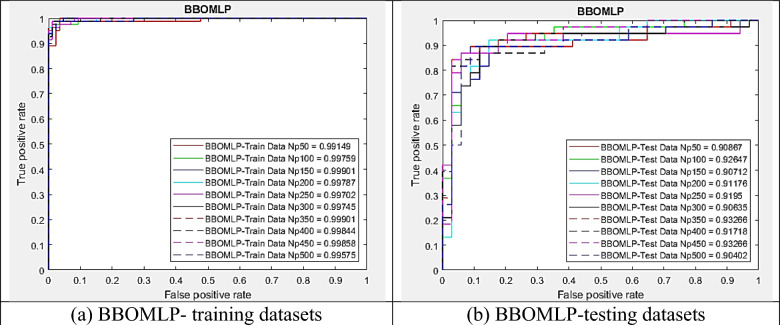
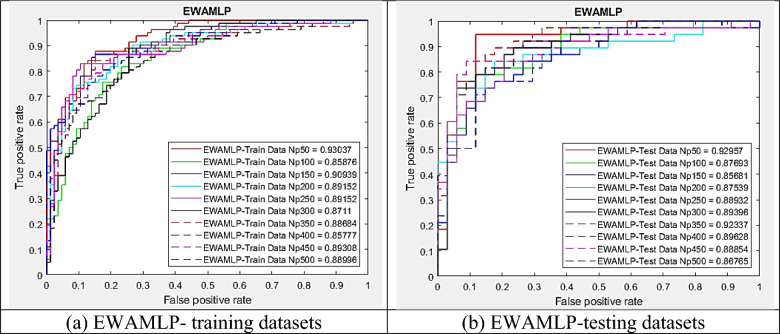
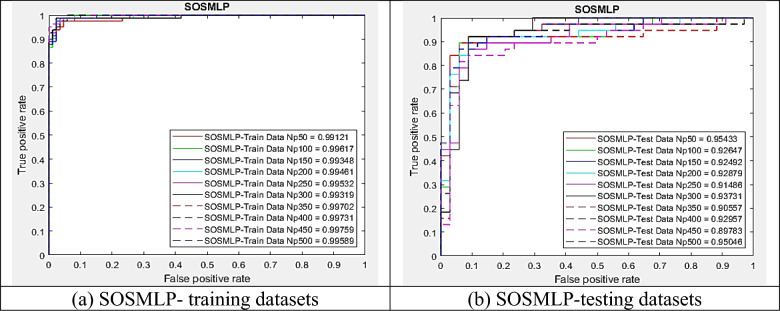
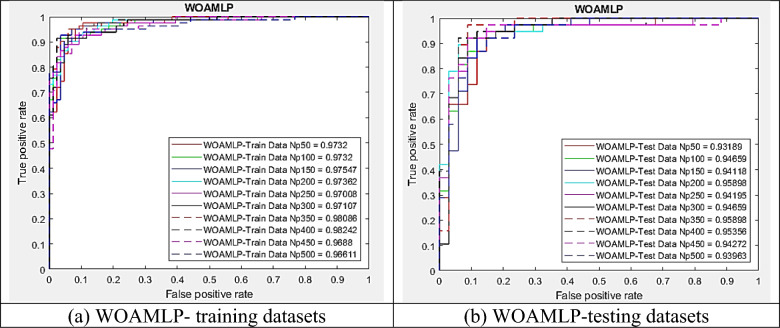
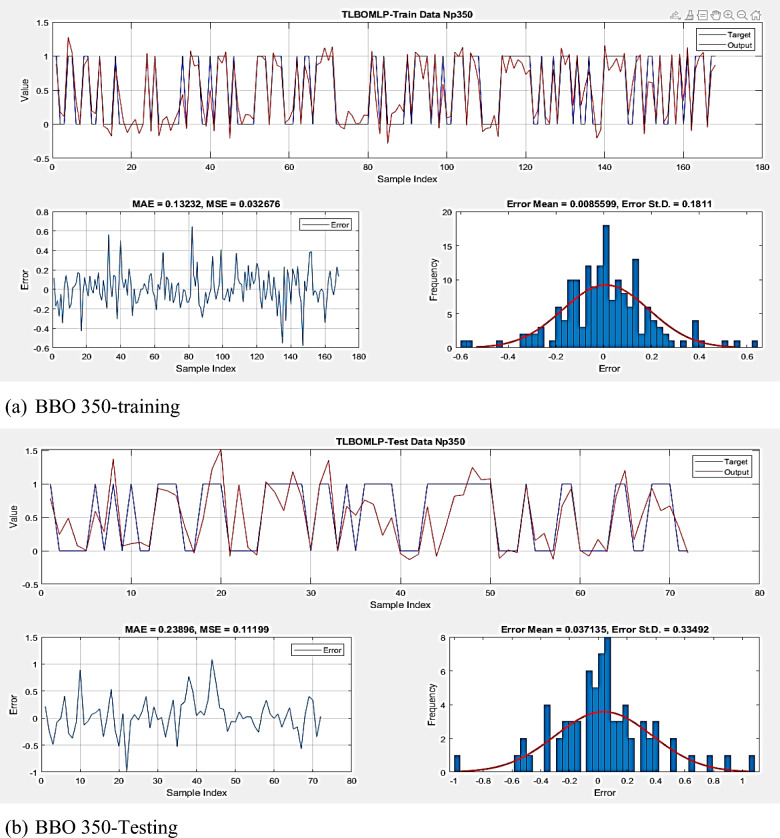
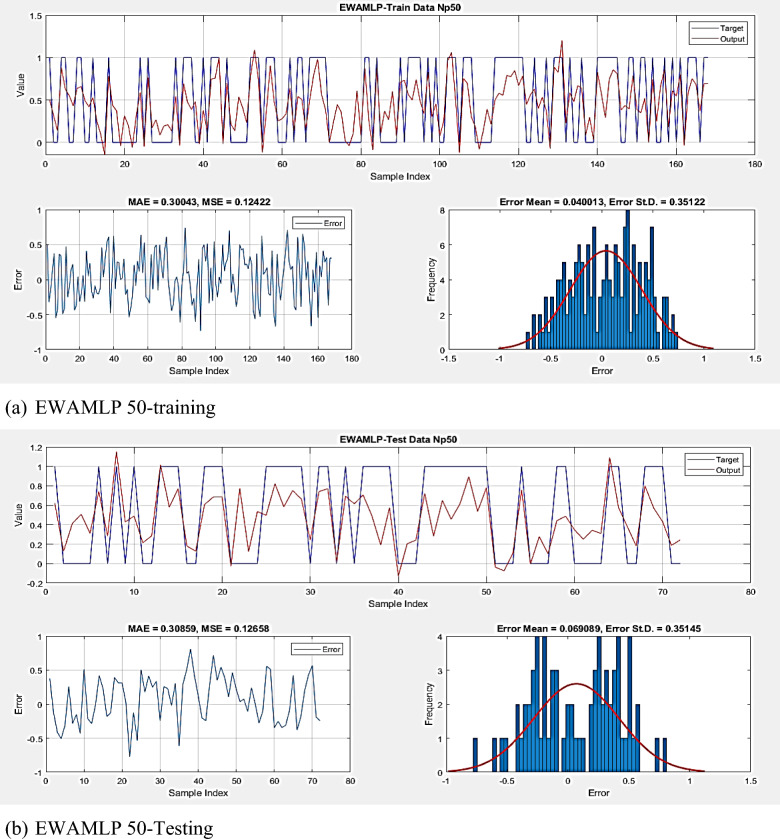
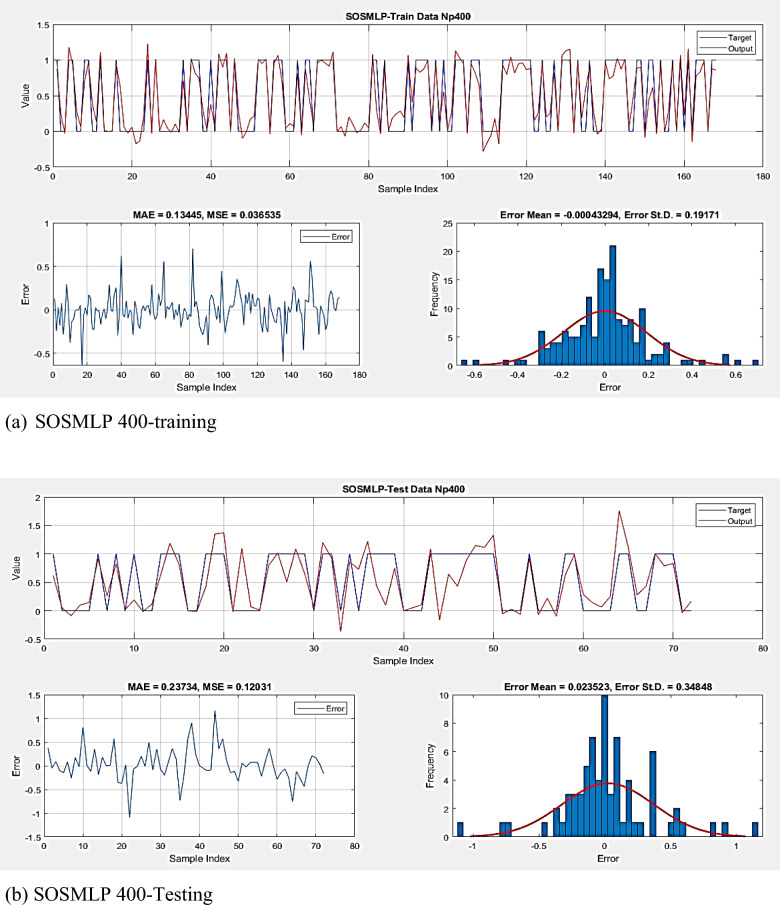
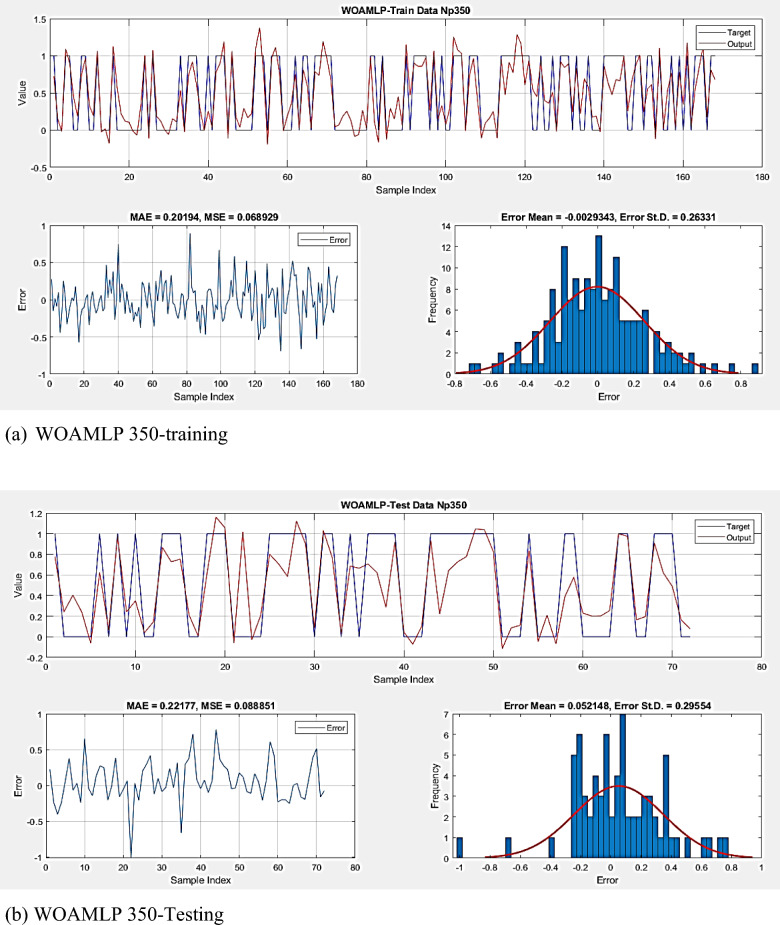
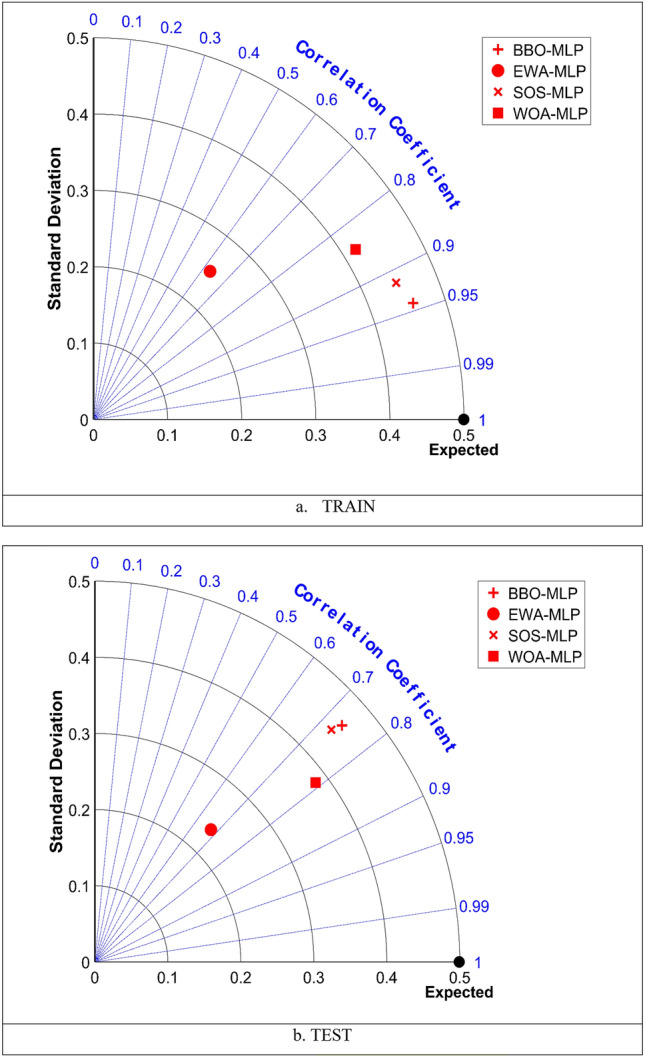
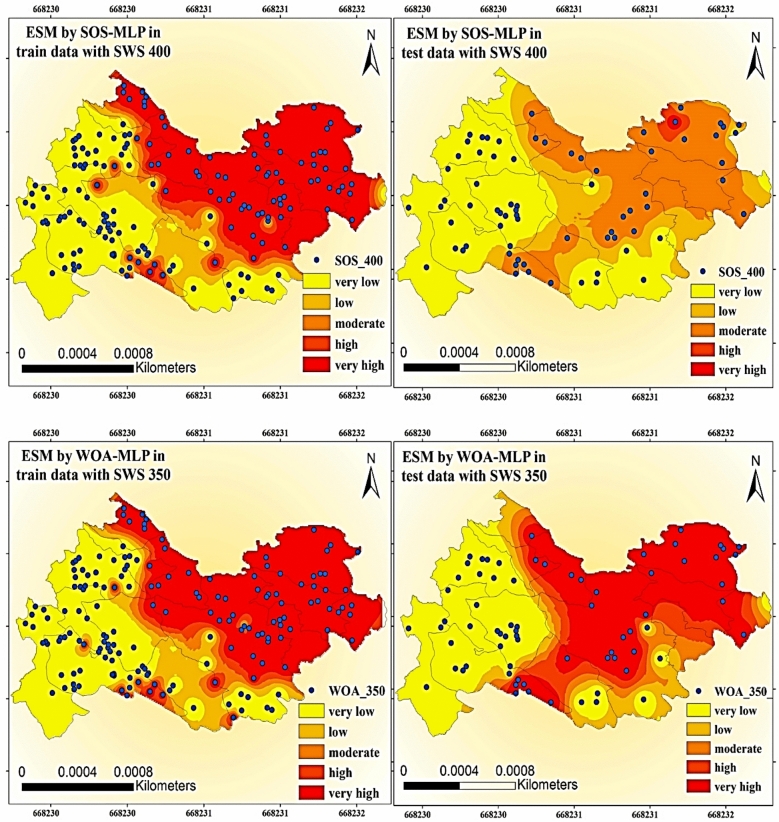
Soil is a critical natural resource, and accurate erosion susceptibility assessment is vital for the optimal management and development of soil resources. Erosion susceptibility assessment is necessary for long-term conservation plans, but the process can be expensive and time-consuming over large areas. It is imperative to examine the impact of water-induced erosion on cultivated lands, as it can cause significant damage. This study evaluates the effectiveness of four data-driven approaches (biogeography-based optimization, earthworm optimization algorithm, symbiotic organisms search, and whale optimization algorithm) combined with artificial neural network models for the assessment of erosion susceptibility. The examined criteria include 14 geographic and environmental criteria, and the data used in a ratio of 70 to 30 for training and testing operations. And its results were measured by AUC values. The evaluation of AUC accuracy indices revealed compelling results. Specifically, in the case of SOS-MLP, the highest AUC values were observed, reaching 0.9973 for test data and 0.9296 for train data. Conversely, for WOA-MLP, the AUC values obtained were slightly lower but still notable, registering at 0.9809 for test data and 0.959 for train data. These values were also calculated for BBO-MLP (0.999 and 0.9327) and EWA-MLP (0.9304 and 0.9296) in the training and testing phases, respectively. Results showed that all four methods could successfully evaluate erosion susceptibility according to AUC values greater than 0.92, especially the BBO-MLP with the highest AUC values. Therefore, the findings of this study have shown that the combined optimization algorithms and Machine Learning used in this research have a suitable ability to optimize the artificial neural network and are very useful for identifying areas sensitive to erosion.
Keywords: Artificial neural network; Erosion susceptibility map (ESM); Optimization algorithms; Risk management.
© 2025. The Author(s).
Conflict of interest statement
Declarations. Ethical approval: All ethical responsibilities are considered regarding the publication of this paper. Informed consent: All authors have read and agreed to the published version of the manuscript. Competing interests: The authors declare no competing interests.
Figures

Similar articles
-
Systemic pharmacological treatments for chronic plaque psoriasis: a network meta-analysis.Cochrane Database Syst Rev. 2017 Dec 22;12(12):CD011535. doi: 10.1002/14651858.CD011535.pub2. Cochrane Database Syst Rev. 2017. Update in: Cochrane Database Syst Rev. 2020 Jan 9;1:CD011535. doi: 10.1002/14651858.CD011535.pub3. PMID: 29271481 Free PMC article. Updated.
-
Diagnostic tests and algorithms used in the investigation of haematuria: systematic reviews and economic evaluation.Health Technol Assess. 2006 Jun;10(18):iii-iv, xi-259. doi: 10.3310/hta10180. Health Technol Assess. 2006. PMID: 16729917
-
Systemic pharmacological treatments for chronic plaque psoriasis: a network meta-analysis.Cochrane Database Syst Rev. 2021 Apr 19;4(4):CD011535. doi: 10.1002/14651858.CD011535.pub4. Cochrane Database Syst Rev. 2021. Update in: Cochrane Database Syst Rev. 2022 May 23;5:CD011535. doi: 10.1002/14651858.CD011535.pub5. PMID: 33871055 Free PMC article. Updated.
-
Management of urinary stones by experts in stone disease (ESD 2025).Arch Ital Urol Androl. 2025 Jun 30;97(2):14085. doi: 10.4081/aiua.2025.14085. Epub 2025 Jun 30. Arch Ital Urol Androl. 2025. PMID: 40583613 Review.
-
A rapid and systematic review of the clinical effectiveness and cost-effectiveness of paclitaxel, docetaxel, gemcitabine and vinorelbine in non-small-cell lung cancer.Health Technol Assess. 2001;5(32):1-195. doi: 10.3310/hta5320. Health Technol Assess. 2001. PMID: 12065068
References
-
- Peter Heng, B., Chandler, J. H. & Armstrong, A. Applying close range digital photogrammetry in soil erosion studies. Photogram. Rec.25(131), 240–265 (2010).
-
- Aldrich, G. A., Tanaka, J. A., Adams, R. M. & Buckhouse, J. C. Economics of western juniper control in central Oregon. Rangel. Ecol. Manag.58(5), 542–552 (2005).
-
- Akay, A. E., Erdas, O., Reis, M. & Yuksel, A. Estimating sediment yield from a forest road network by using a sediment prediction model and GIS techniques. Build. Environ.43(5), 687–695 (2008).
-
- Gholami, V. & Khalegi, M. The impact of vegetation on the bank erosion (case study: the Haraz river). Soil Water Res.8(4), 158–164 (2013).
-
- Prager, K. et al. Soil degradation, farming practices, institutions and policy responses: An analytical framework. Land Degrad. Dev.22(1), 32–46 (2011).
LinkOut - more resources
Full Text Sources
