

Unveiling the root-rhizosphere environment of perennial wheat: a metabolomic perspective
- PMID: 40691757
- PMCID: PMC12281685
- DOI: 10.1186/s12870-025-07008-5
Unveiling the root-rhizosphere environment of perennial wheat: a metabolomic perspective
Abstract
Background: Perennial grain roots grow continuously, enhancing soil carbon sequestration and forming a "holobiont" with the microbiome, essential for nutrient acquisition and stress resilience. Consequently, perennial grains serve as ideal models for investigating long-term dynamics between root systems and the rhizosphere environment. Despite their potential, the rhizosphere environment of perennial grains remains underexplored. This research utilizes an untargeted metabolomic approach to characterize the root-rhizosphere molecular signals in four new perennial grain (NPGs) lines named 235a, 280b, 11,955, and OK72, across four years of growth.
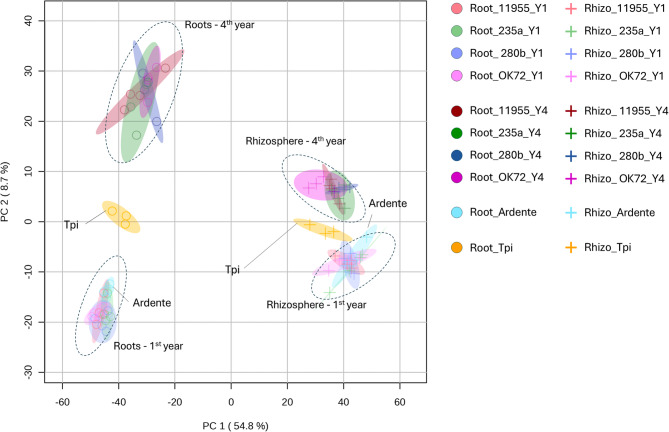
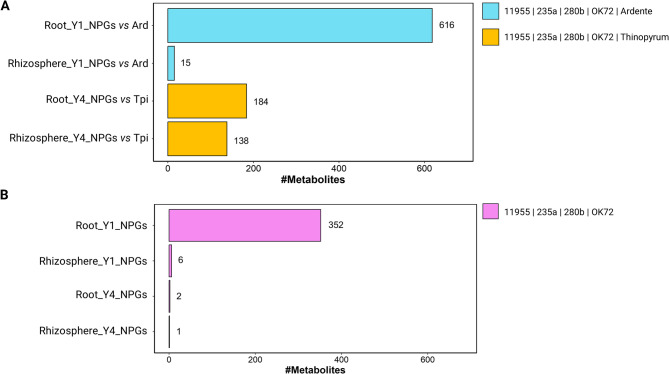
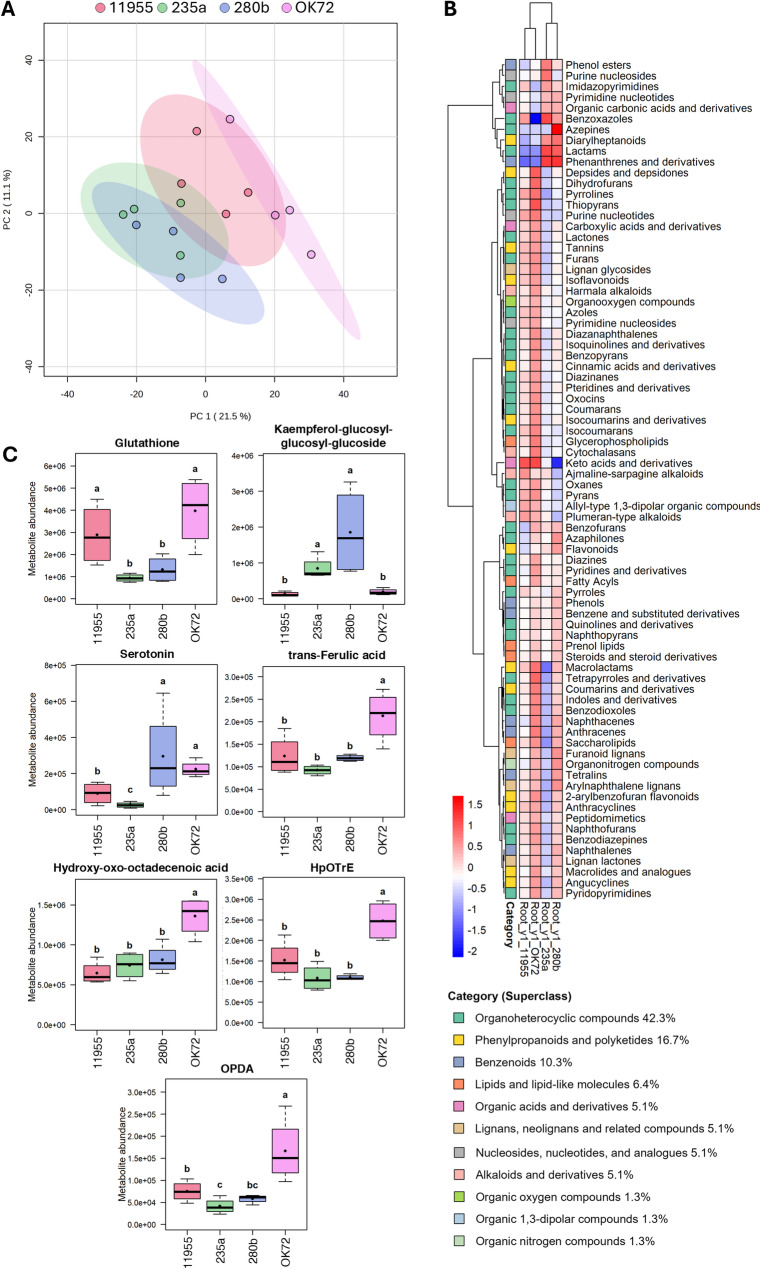
Results: Metabolomic analysis annotated 2,527 metabolites, most of which originated from fungi (30.3%), bacteria (23%), and plants (15.5%). Principal component analysis explained 54.8% of the variation between rhizosphere and root metabolites, with 8.7% variation separating 1st and 4th year root metabolites, while rhizosphere metabolites showed less variation between years. The comparison between the annual durum wheat variety and NPGs revealed 616 differentially abundant metabolites in roots and 15 in the rhizosphere, already at the 1st year of growth. In the 4th year, NPGs metabolomes diverged significantly from Thinopyrum intermedium, which stood in the soil for 11 years, with 184 root and 138 rhizosphere differentially abundant metabolites. Comparison between genotypes diversified NPGs in the 1st year, showing a higher abundance of root metabolites for OK72 compared to the other lines, including key modulators of root architecture like glutathione and serotonin, and compounds from α-linoleic acid metabolism, which are known to induce systemic resistance against pathogens and herbivore defense. Differences among NPGs also emerged in the 4th year, with OK72 separating from the other three, sharing with Thinopyrum intermedium a higher abundance of purine nucleosides and diazanaphthalenes.
Conclusions: The metabolomic analysis revealed that starting from the 1st year, the roots of NPGs produce a set of metabolites distinct from those of the annual durum species, many of which are defense molecules against biotic and abiotic stresses (e.g., syringic acid, glutathione, and α-linoleic acid pathway compounds). The OK72 genotype, which exhibits below-ground traits more aligned with perennialism, differs from the other lines in the abundance of several interesting metabolites, confirming it as an ideal parental candidate for developing new perennial wheat lines.
Keywords: Crop resilience; Perennialism trait; Rhizosphere environment; Root metabolomics.
© 2025. The Author(s).
Conflict of interest statement
Declarations. Ethics approval and consent to participate: Not applicable. Consent for publication: Not applicable. Competing interests: The authors declare no competing interests.
Figures


Similar articles
-
The balance between rhizosphere carboxylates and arbuscular mycorrhizal symbiosis in wheat phosphorus acquisition.BMC Plant Biol. 2025 Aug 6;25(1):1031. doi: 10.1186/s12870-025-07023-6. BMC Plant Biol. 2025. PMID: 40770683 Free PMC article.
-
Soil Moisture and Its Interaction With Temperature Determine Root Metabolomes of a Himalayan Alpine Shrub.Physiol Plant. 2025 Jul-Aug;177(4):e70444. doi: 10.1111/ppl.70444. Physiol Plant. 2025. PMID: 40798898 Free PMC article.
-
The Black Book of Psychotropic Dosing and Monitoring.Psychopharmacol Bull. 2024 Jul 8;54(3):8-59. Psychopharmacol Bull. 2024. PMID: 38993656 Free PMC article. Review.
-
Short-Term Memory Impairment.2024 Jun 8. In: StatPearls [Internet]. Treasure Island (FL): StatPearls Publishing; 2025 Jan–. 2024 Jun 8. In: StatPearls [Internet]. Treasure Island (FL): StatPearls Publishing; 2025 Jan–. PMID: 31424720 Free Books & Documents.
-
Root architecture and the rhizosphere microbiome: Shaping sustainable agriculture.Plant Sci. 2025 Oct;359:112599. doi: 10.1016/j.plantsci.2025.112599. Epub 2025 Jun 5. Plant Sci. 2025. PMID: 40482721 Review.
References
-
- Massalha H, Korenblum E, Tholl D, Aharoni A. Small molecules below-ground: the role of specialized metabolites in the rhizosphere. Plant J. 2017;90(4):788–807. 10.1111/tpj.13543. - PubMed
-
- Jingjing Y, Huiqin G, Fry EL, De Long JR, Shiming T, Ting Y, Weibo R. Plant roots send metabolic signals to microbes in response to long-term overgrazing. Sci Total Environ. 2022;842:156241. 10.1016/j.scitotenv.2022.156241. - PubMed
-
- Sangwan NS, Jadaun JS, Tripathi S, Mishra B, Narnoliya LK, Sangwan RS. Plant metabolic engineering. In: Barh D, Azevedo V, editors. Omics technologies and bio-engineering. Academic Press: Cambridge, Massachusetts, USA; 2018. pp. 143–75. 10.1016/B978-0-12-815870-8.00009-7.
-
- Aguirre-Becerra H, Vazquez-Hernandez MC, de la Saenz OD, Alvarado-Mariana A, Guevara-Gonzalez RG, Garcia-Trejo JF, Feregrino-Perez AA. Role of stress and defense in plant secondary metabolites production. In: Pal D, Nayak AK, editors. Bioactive natural products for pharmaceutical applications. Springer; 2021. pp. 151–95. 10.1007/978-3-030-54027-2_5.
MeSH terms
Grants and funding
LinkOut - more resources
Full Text Sources
