

Anatomical and behavioral characterization of three hemiplegic animal models
- PMID: 40691765
- PMCID: PMC12278650
- DOI: 10.1186/s12868-025-00961-9
Anatomical and behavioral characterization of three hemiplegic animal models
Abstract
Background: Hemiplegia is characterized by muscle weakness on one side of the body, often resulting from damage to the brain, spinal cord, or associated nerves. This condition commonly occurs due to strokes, traumatic brain injuries (TBI), or spinal cord injuries (SCI), which can damage corticospinal neurons (CSNs) and the corticospinal tract (CST). However, there is still a notable lack of comprehensive studies that systematically characterize the anatomical and behavioral aspects of these hemiplegic animal models.
Objective: This study aimed to validate and compare existing models of TBI, stroke, and SCI in order to identify the most suitable preclinical hemiplegia models for future research.
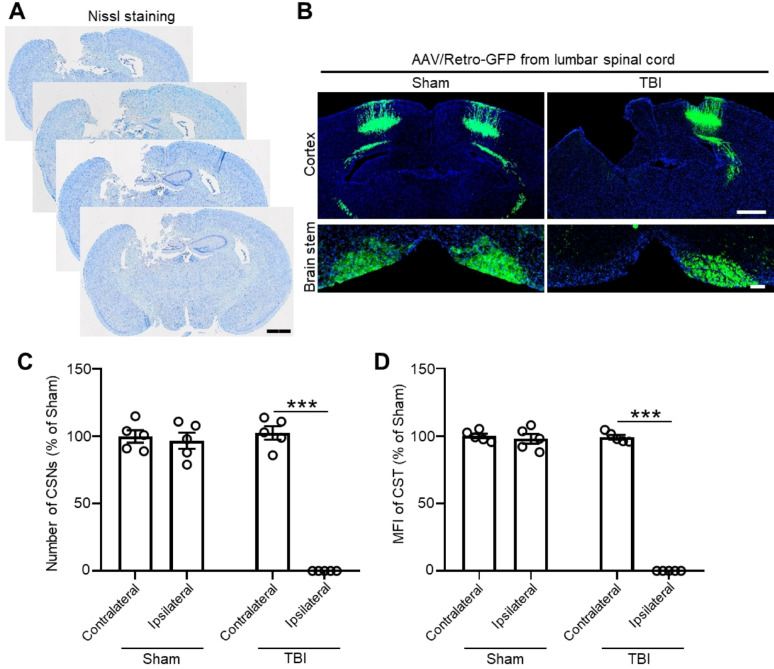
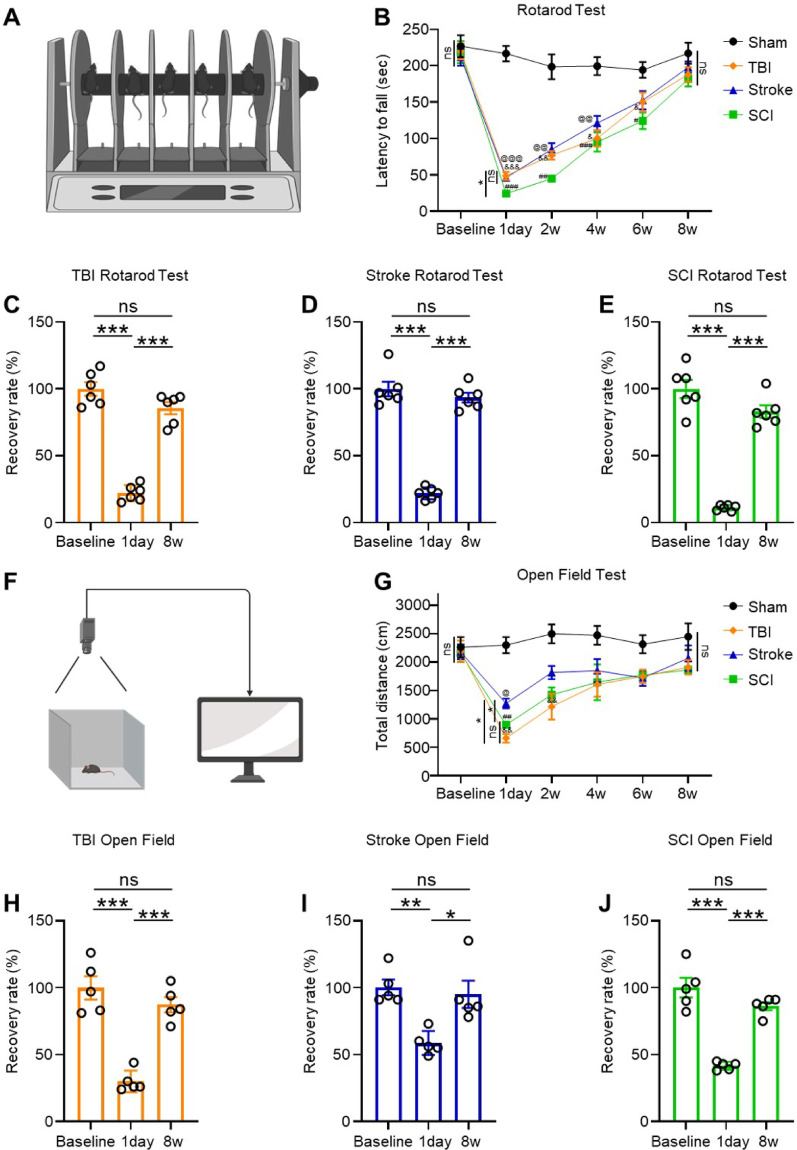
Method: Using viral-based retrograde tracing, we first mapped the cortical distribution of CSNs responsible for hindlimb movement. Anterograde and retrograde viral tracing techniques were then employed to label and evaluate the damage to CSNs and the CST in three models: photothrombotic stroke, Feeney's weight-drop TBI, and T10 hemi-section SCI. We also conducted behavioral tests to assess spontaneous motor function recovery, including open field and rotarod tests for gross motor function, as well as beam walking and irregular ladder walking tasks for assessing skilled motor function.
Results: Our findings revealed that the CSNs controlling hindlimb movement are concentrated in the hindlimb region of the primary somatosensory cortex (S1HL). In the TBI and stroke models, there was complete destruction of ipsilateral CSNs in the S1HL and loss of CST fibers governing hindlimb movement. In the SCI model, ipsilateral CST fibers below T10 were also lost. After 8 weeks post-injury, all three groups of hemiplegic mice showed improvements in motor function, with gross motor function returning to normal levels; however, the recovery of skilled motor function was only modest. Notably, the degree of improvement in fine motor skills varied among the hemiplegia models, with mice subjected to brain injury (stroke and TBI) demonstrating significantly greater recovery in fine motor skills compared to those with SCI.
Conclusion: We confirmed and validated previous hemiplegia models by damaging CSNs or CST controlling hindlimb movement. Post-injury, gross motor function gradually returned to normal levels across all groups, whereas recovery of skilled motor function was limited. Furthermore, there were significant differences in the recovery of skilled motor function between brain injury models and the SCI model. These hemiplegic mouse models are valuable tools for studying post-injury skilled motor functions.
Clinical trial number: Not applicable.
Keywords: Hemiplegia; Motor function recovery; Spinal cord injury; Stroke; Traumatic brain injury.
© 2025. The Author(s).
Conflict of interest statement
Declarations. Conflict of interest: The authors declare no competing interests. Ethics approval and consent to participate: All experiments are reported in compliance with the Animal Research: Reporting of In Vivo Experiments (ARRIVE) guidelines. The experimental protocols were approved by the Laboratory Animal Welfare and Ethics Committee of the 904th Hospital of PLA (20220215) and performed according to the Guide for the Care and Use of Laboratory Animals. Consent for publication: Not applicable.
Figures


Similar articles
-
Prescription of Controlled Substances: Benefits and Risks.2025 Jul 6. In: StatPearls [Internet]. Treasure Island (FL): StatPearls Publishing; 2025 Jan–. 2025 Jul 6. In: StatPearls [Internet]. Treasure Island (FL): StatPearls Publishing; 2025 Jan–. PMID: 30726003 Free Books & Documents.
-
Management of faecal incontinence and constipation in adults with central neurological diseases.Cochrane Database Syst Rev. 2014 Jan 13;2014(1):CD002115. doi: 10.1002/14651858.CD002115.pub5. Cochrane Database Syst Rev. 2014. Update in: Cochrane Database Syst Rev. 2024 Oct 29;10:CD002115. doi: 10.1002/14651858.CD002115.pub6. PMID: 24420006 Free PMC article. Updated.
-
Management of faecal incontinence and constipation in adults with central neurological diseases.Cochrane Database Syst Rev. 2013 Dec 18;(12):CD002115. doi: 10.1002/14651858.CD002115.pub4. Cochrane Database Syst Rev. 2013. Update in: Cochrane Database Syst Rev. 2014 Jan 13;(1):CD002115. doi: 10.1002/14651858.CD002115.pub5. PMID: 24347087 Updated.
-
Effects of scalp acupuncture on the limb function recovery of hemiplegia after moderate to severe traumatic brain injury.Physiol Int. 2025 Mar 13;112(1):56-67. doi: 10.1556/2060.2025.00503. Print 2025 Mar 27. Physiol Int. 2025. PMID: 40080084 Clinical Trial.
-
Technological aids for the rehabilitation of memory and executive functioning in children and adolescents with acquired brain injury.Cochrane Database Syst Rev. 2016 Jul 1;7(7):CD011020. doi: 10.1002/14651858.CD011020.pub2. Cochrane Database Syst Rev. 2016. PMID: 27364851 Free PMC article.
References
-
- Lattouf NA, et al. Eccentric training effects for patients with post-stroke hemiparesis on strength and speed gait: A randomized controlled trial. NeuroRehabilitation. 2021;48(4):513–22. - PubMed
-
- Zackowski KM, et al. How do strength, sensation, spasticity and joint individuation relate to the reaching deficits of people with chronic hemiparesis? Brain. 2004;127(Pt 5):1035–46. - PubMed
MeSH terms
Grants and funding
LinkOut - more resources
Full Text Sources
Medical
Research Materials
