

Determination of the effect of pyocyanin and Saccharomyces boulardii on gut microbiota and TLR4/MyD88/NF-κB and NLRP3 signaling pathways in sepsis induced by cecal ligation and puncture in rats
- PMID: 40691769
- PMCID: PMC12281731
- DOI: 10.1186/s12879-025-11308-4
Determination of the effect of pyocyanin and Saccharomyces boulardii on gut microbiota and TLR4/MyD88/NF-κB and NLRP3 signaling pathways in sepsis induced by cecal ligation and puncture in rats
Abstract
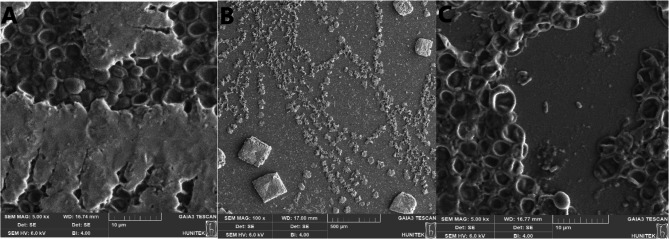
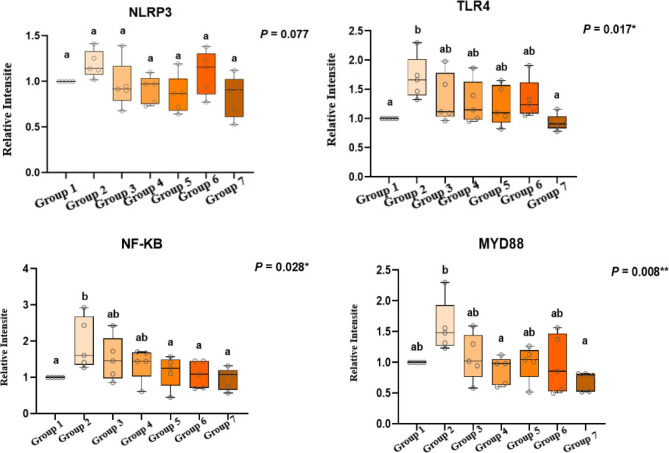
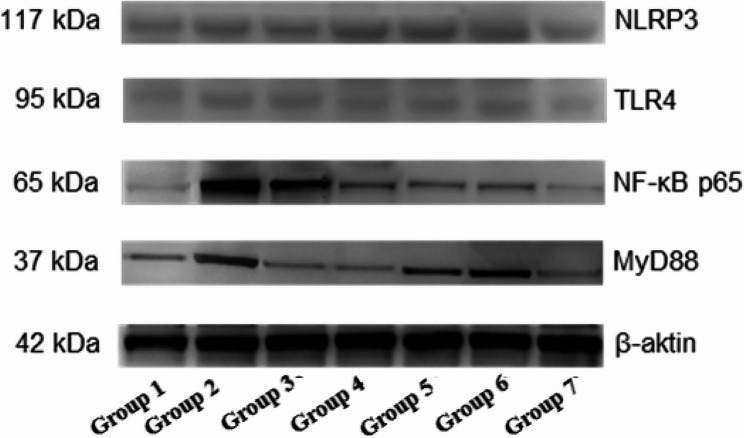
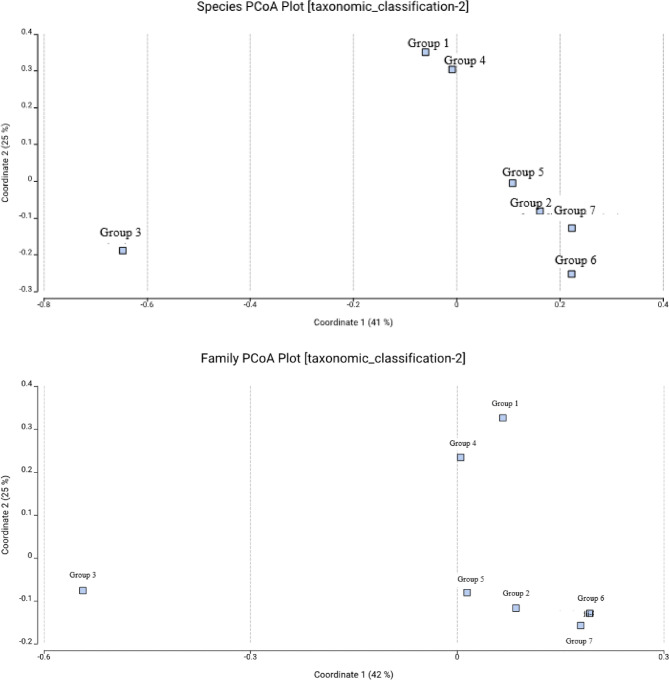
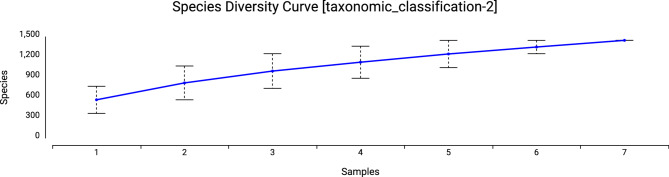
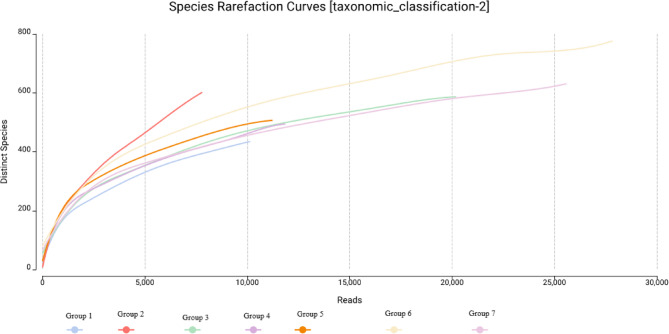
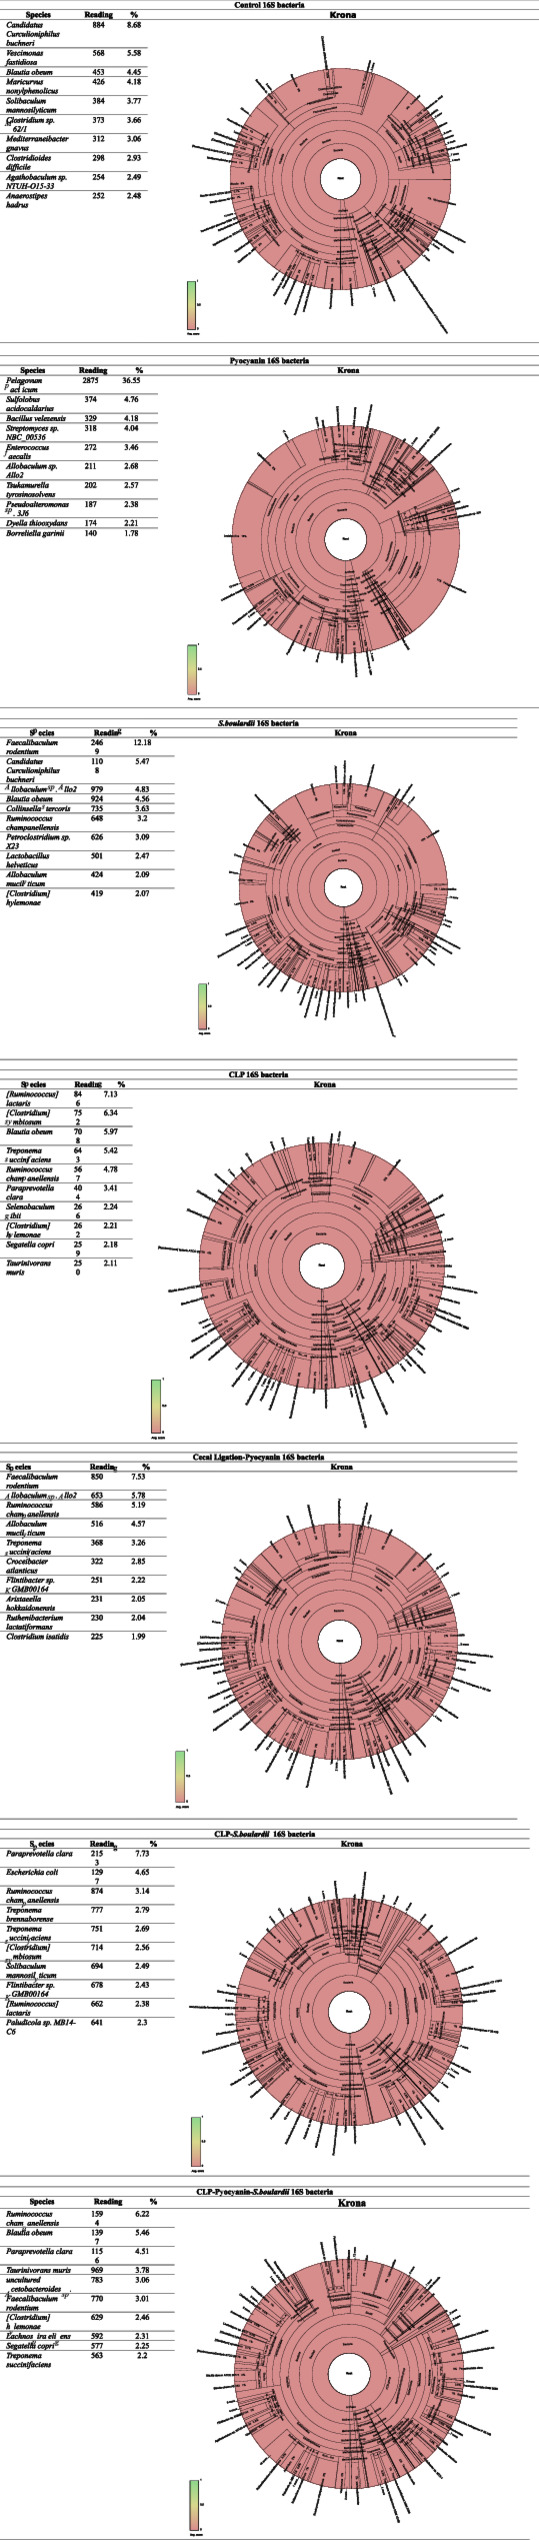
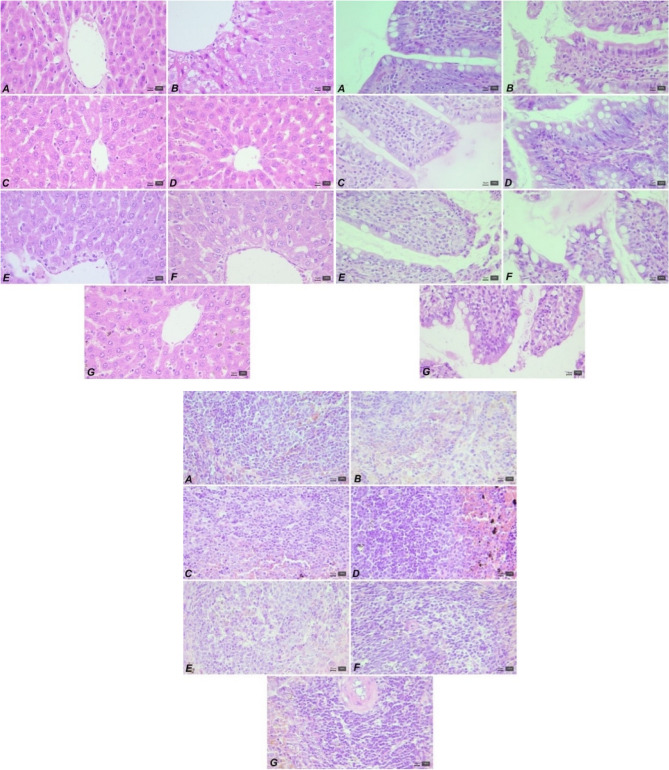
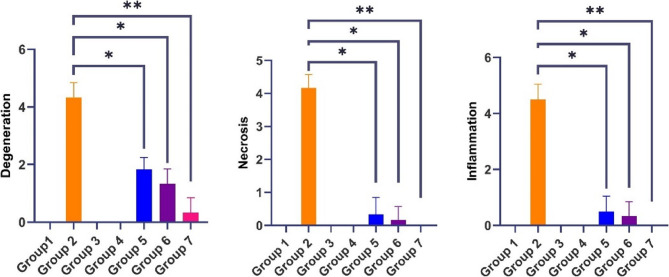
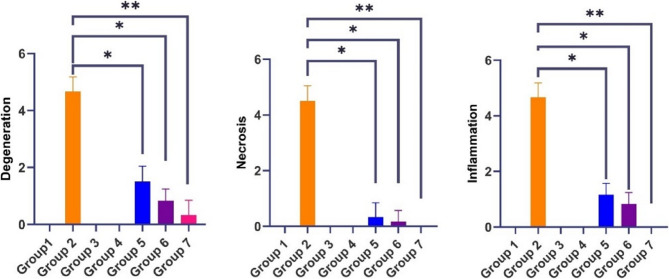
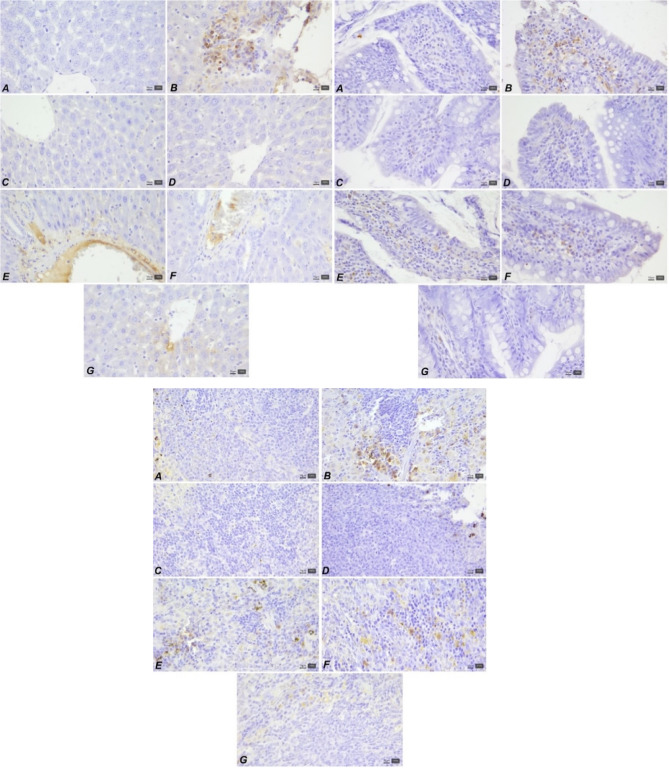
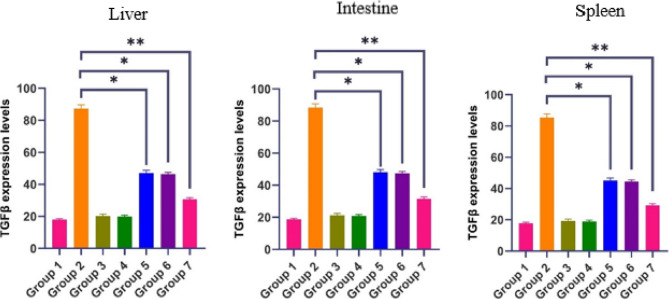
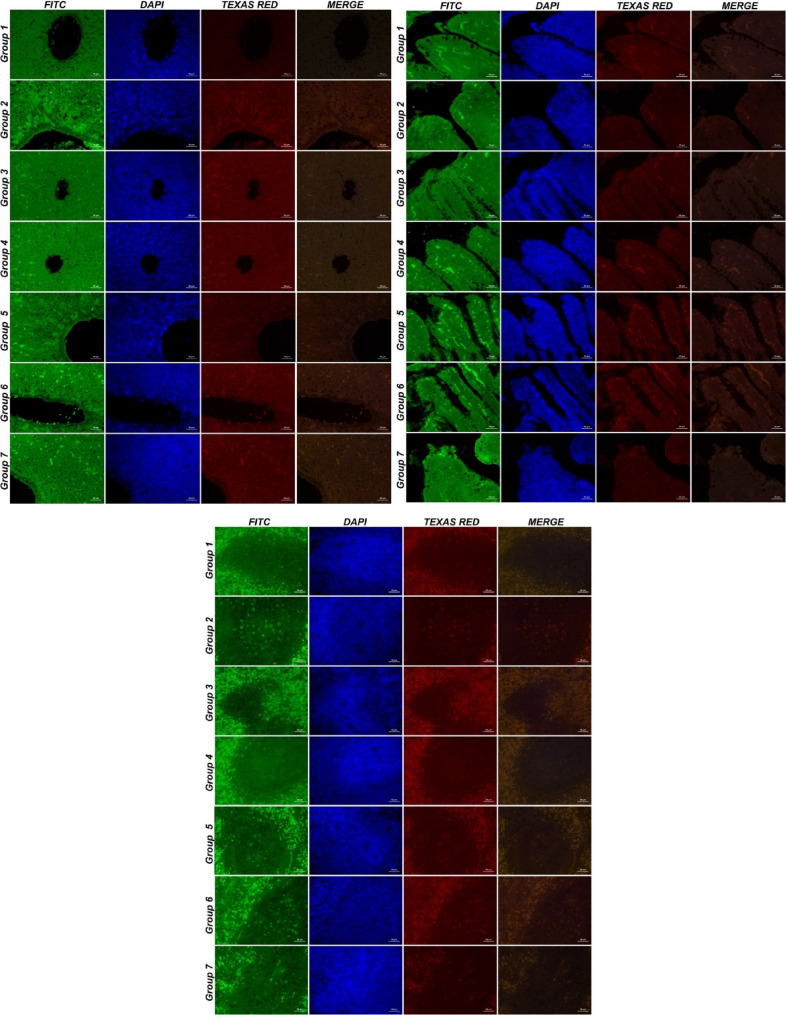
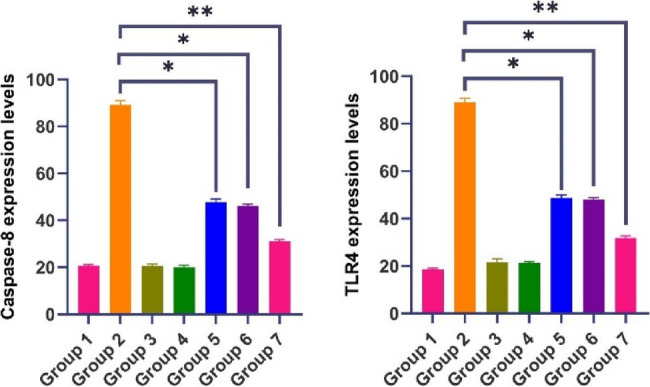
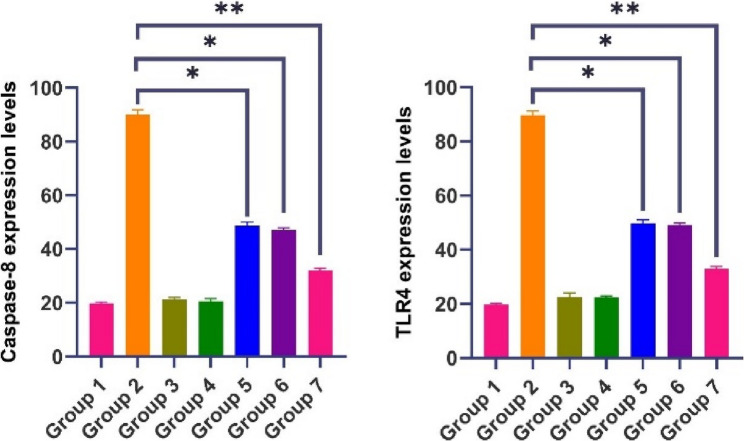
Sepsis is a life-threatening systemic inflammatory condition marked by a dysregulated host response to infection. The intestinal microbiota plays a pivotal role in maintaining immune homeostasis and epithelial barrier integrity, whereas dysbiosis significantly contributes to the pathogenesis of sepsis. This study investigates the effects of the Pseudomonas aeruginosa-derived metabolite Pyocyanin and the probiotic Saccharomyces boulardii (S. boulardii) on microbial composition and the TLR4/MyD88/NF-κB/NLRP3 signaling axis in a cecal ligation and puncture (CLP)-induced rat model of sepsis. The experimental design assessed the synergistic or antagonistic effects of single and combined treatments using molecular, microbiome, and immunohistochemical parameters to evaluate histopathological damage and microbial ecological dynamics. Seven experimental groups were established following CLP. Intra-abdominal Pyocyanin (10 nmol/g) and oral probiotic (10⁶ CFU/kg) treatments were administered either individually or in combination. Focused Ion Beam - Scanning Electron Microscopy (FIB-SEM) analyses revealed that the amorphous structure of Pyocyanin interacted with the surface of S. boulardii. Western blot analysis showed a 2.3-fold increase in TLR4/NF-κB expression in the CLP group (p ≤ 0.05), which synergistically rose to 4.5-fold with Pyocyanin (p ≤ 0.001), whereas probiotic treatment decreased expression levels by 35%. According to 16 S rRNA sequencing, Pyocyanin reduced α-diversity by increasing Lactobacillaceae abundance to 32.66% (Shannon index: 3.598 vs. 4.433 in control), while S. boulardii enhanced β-diversity by elevating Coriobacteriaceae (5.85%) and Prevotellaceae (10.63%) levels (Tables 2, 3 and 4). PCoA confirmed 41.7% Bray-Curtis dissimilarity between groups at the species level (PERMANOVA R²=0.38, p = 0.002). Histopathologically, severe hepatocyte necrosis (73.2 ± 6.1%, p = 0.0022) and a 4.2-fold increase in hepatic TGF-β expression were observed in the CLP group, whereas epithelial barrier damage was significantly attenuated in the probiotic groups. Immunofluorescence analysis revealed that combined treatment reduced Caspase-8 and TLR4 expression by 28% compared to Pyocyanin alone (p ≤ 0.05). In conclusion, S. boulardii supported microbiota homeostasis by suppressing TLR4/NF-κB signaling, whereas Pyocyanin exacerbated the inflammatory response via NLRP3 activation. These findings provide molecular evidence supporting probiotic-assisted immunomodulatory strategies in sepsis therapy.
Keywords: Saccharomyces boulardii; Gut microbiota; Pyocyanin; Sepsis; Western blot.
© 2025. The Author(s).
Conflict of interest statement
Declarations. Ethics approval and consent to participate: The experimental protocol was reviewed and approved by the Atatürk University Local Ethics Committee for Animal Experiments (AÜHADYEK) (29.04.2024 Meeting Date, Meeting number: 2024/04 and Decision no: 93). Consent for publication: Not applicable. Competing interests: The authors declare no competing interests.
Figures


Similar articles
-
Combination of Withania coagulans and Fagonia cretica ameliorates hyperuricemia by re-modulating gut microbiota-derived spermidine and traumatic acid.Phytomedicine. 2025 Sep;145:157079. doi: 10.1016/j.phymed.2025.157079. Epub 2025 Jul 17. Phytomedicine. 2025. PMID: 40712280
-
Saccharomyces boulardii (CNCM I-745) improves intestinal damage in sepsis by remodeling intestinal flora structure.Front Cell Infect Microbiol. 2025 Jul 31;15:1602792. doi: 10.3389/fcimb.2025.1602792. eCollection 2025. Front Cell Infect Microbiol. 2025. PMID: 40822580 Free PMC article.
-
[Mechanisms of Neiyiting Decoction in Preventing Postoperative Recurrence of Endometriosis by Inhibiting Macrophage M1 Polarization Through the TREM1/TLR4/NF-κB Signaling Pathway].Sichuan Da Xue Xue Bao Yi Xue Ban. 2025 Mar 20;56(2):371-381. doi: 10.12182/20250360601. Sichuan Da Xue Xue Bao Yi Xue Ban. 2025. PMID: 40599271 Free PMC article. Chinese.
-
Vitamin C Protects Against Myocardial Damage Induced by Sepsis by Regulating the JAK2/STAT3 and NF-κB Signaling Pathways.J Surg Res. 2025 Aug 5;314:209-219. doi: 10.1016/j.jss.2025.07.009. Online ahead of print. J Surg Res. 2025. PMID: 40768888 Review.
-
Probiotics for the prevention of pediatric antibiotic-associated diarrhea.Cochrane Database Syst Rev. 2015 Dec 22;(12):CD004827. doi: 10.1002/14651858.CD004827.pub4. Cochrane Database Syst Rev. 2015. Update in: Cochrane Database Syst Rev. 2019 Apr 30;4:CD004827. doi: 10.1002/14651858.CD004827.pub5. PMID: 26695080 Updated.
References
-
- Medina-Félix D, Garibay-Valdez E, Vargas-Albores F, Martínez-Porchas M. Fish disease and intestinal microbiota: A close and indivisible relationship. Reviews Aquaculture. 2023;15(2):820–39.
MeSH terms
Substances
LinkOut - more resources
Full Text Sources
Medical
Miscellaneous
