. 2025 Jul 21;56(1):156.
doi: 10.1186/s13567-025-01595-9.

Increased ROS levels activate AMPK-ULK1-mediated mitophagy to promote pseudorabies virus replication

Affiliations

Increased ROS levels activate AMPK-ULK1-mediated mitophagy to promote pseudorabies virus replication

Yuan Zhao et al. Vet Res. .

Abstract

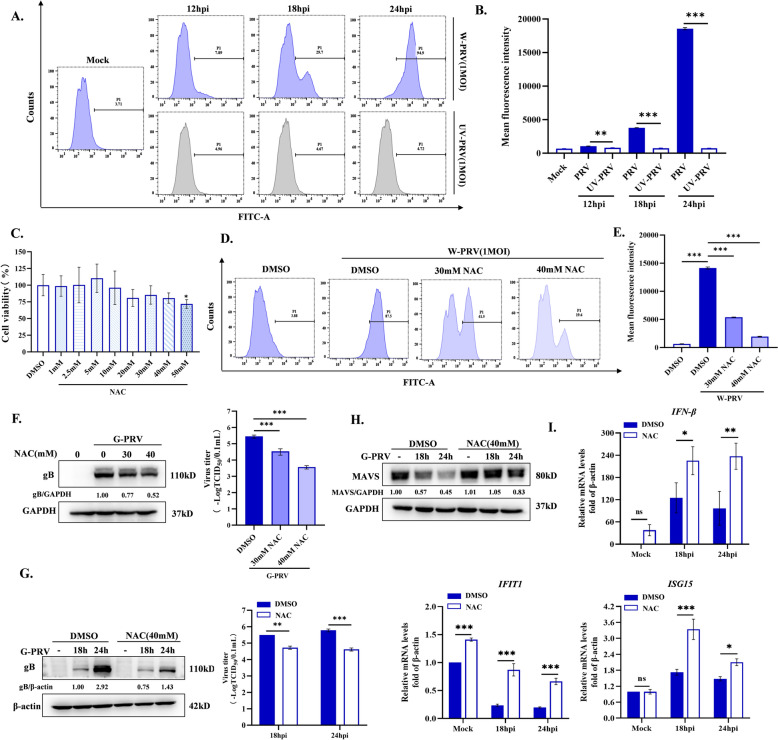
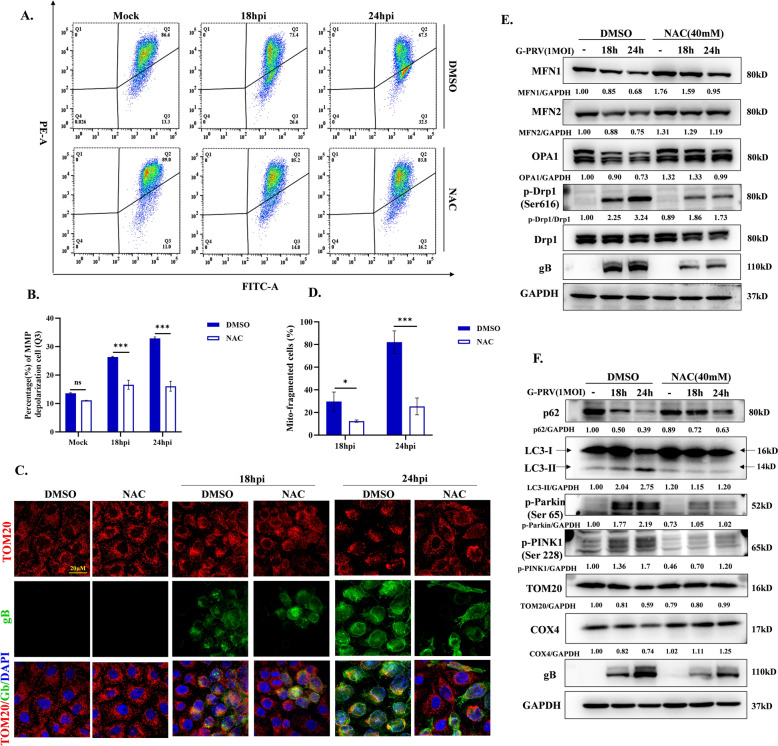
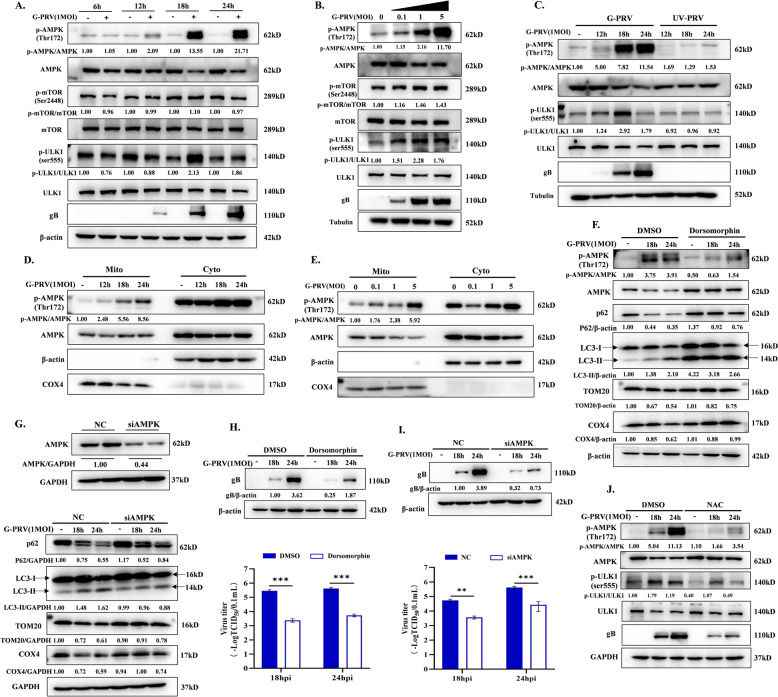
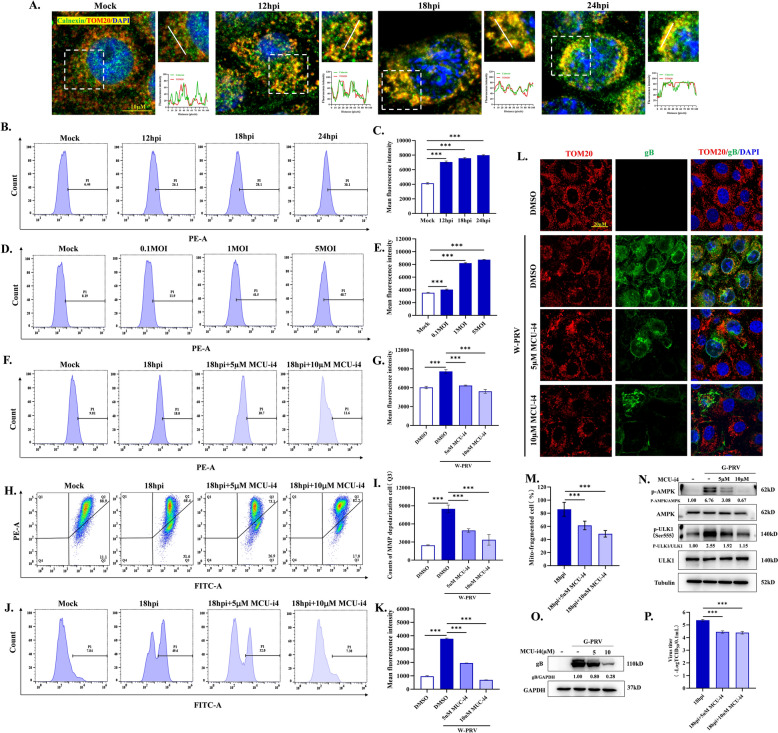
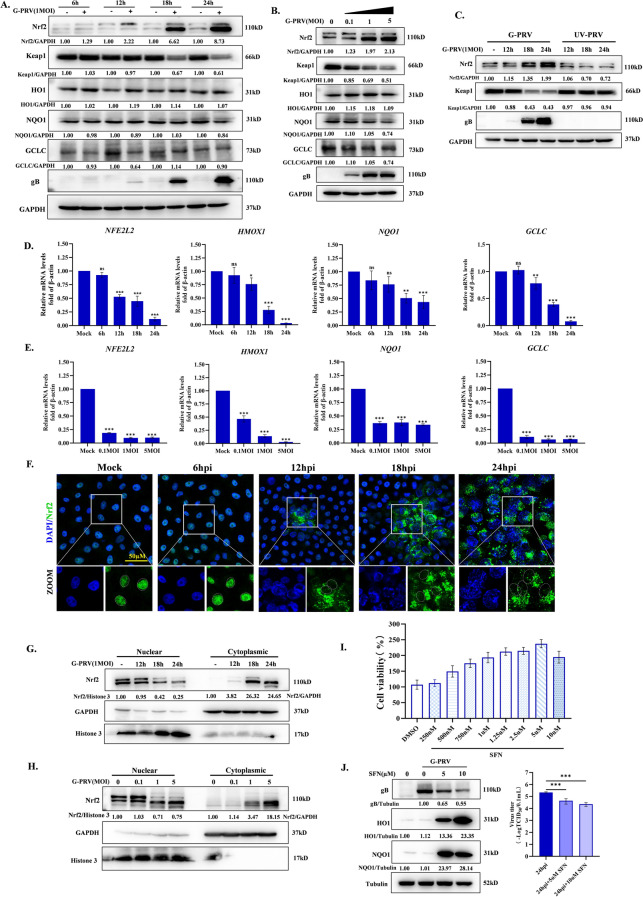
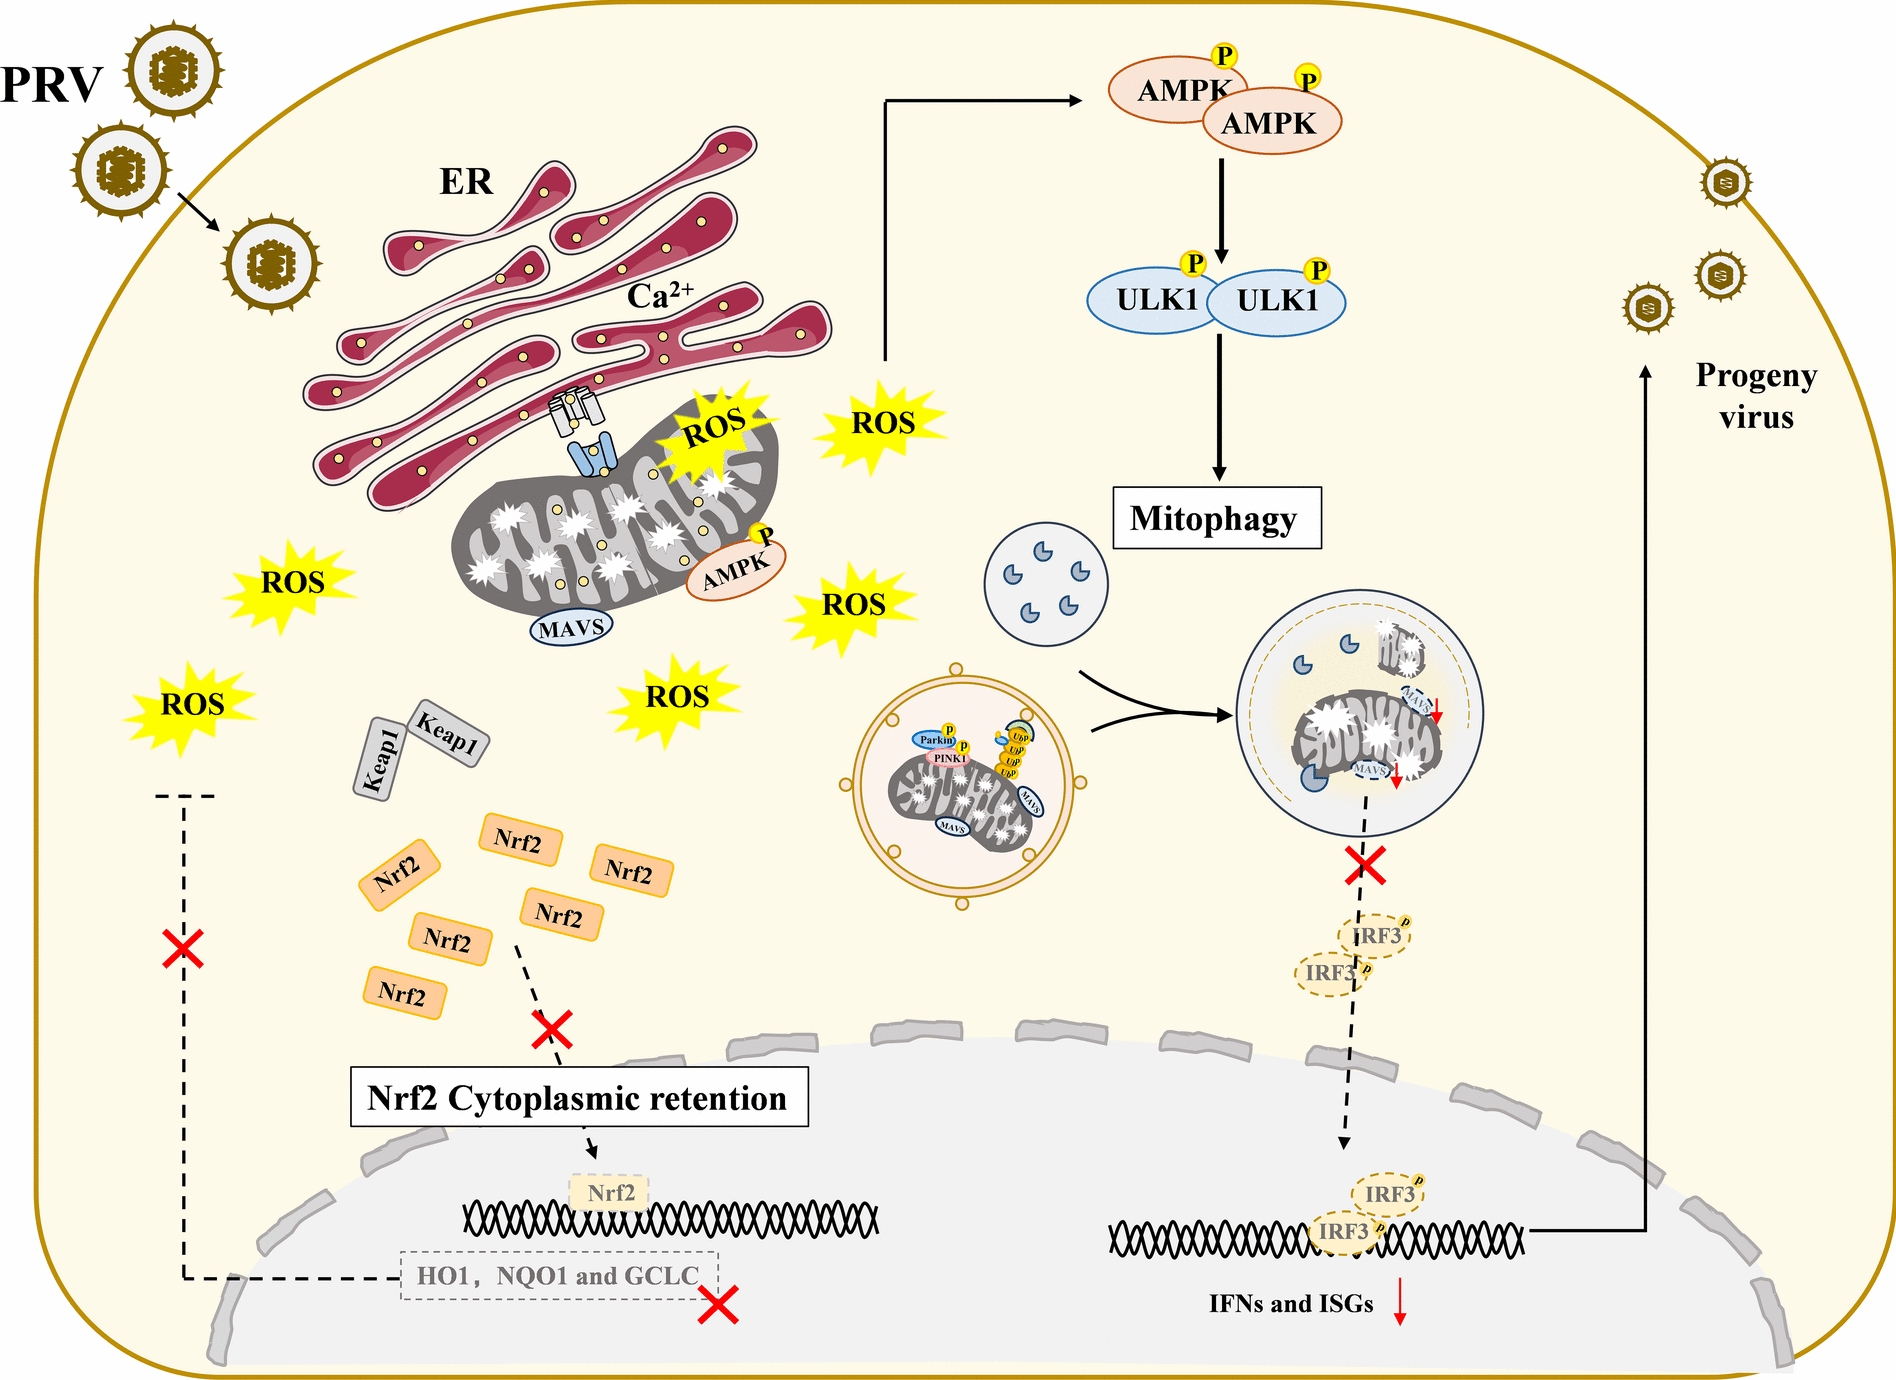
Increasing evidence has confirmed that oxidative stress plays a nonnegligible role in the viral pathogenic process. In this study, we investigated the role of reactive oxygen species (ROS) in the replication of pseudorabies virus (PRV). Our data showed that PRV infection initially enhanced the contact between the endoplasmic reticulum (ER) and mitochondria, leading to an upsurge of mitochondrial Ca2+ (mtCa2+) concentration, which resulted in the loss of mitochondrial membrane potential (MMP) and excessive ROS production. Instead of translocating it to the nucleus, PRV infection concurrently sequestered Nrf2 in cytoplasm impeding the efficient scavenging of intracellular ROS. The excessive ROS production and failure in ROS clearance contributed to the persistently high ROS levels during PRV infection. Furthermore, elevated ROS levels elicited activation of the AMPK-ULK1 axis, initiating PINK1-Parkin-dependent mitophagy that selectively degraded damaged mitochondria along with mitochondrial-localized mitochondrial antiviral signaling protein (MAVS). This process suppressed MAVS-mediated type I interferon responses by eliminating both dysfunctional mitochondria and their associated antiviral signaling platforms, thereby creating a cellular environment permissive to viral replication. Overall, our findings elucidated the mechanism by which ROS enables the virus to resist the host interferon immune response and provided a theoretical basis for ROS-based antiviral strategies.

Keywords: AMPK; Nrf2; Pseudorabies virus; mitochondria Ca2+; mitophagy; reactive oxygen species.


Conflict of interest statement

Declarations. Competing interests: The authors declare that they have no competing interests.

Figures

Figure 1
Figure 1
Effects of ROS levels on PRV replication. A, B Cells were infected with W-PRV or treatment with UV-PRV (equivalent of MOI = 1) at 12, 18, and 24 hpi. ROS levels were detected by flow cytometry using DCFH-DA probe and mean fluorescence intensity was measured. C Cells were treated with different concentrations of NAC for 24 h. Cell viability was detected by CCK-8. D, E ROS levels were detected by flow cytometry using DCFH-DA probe upon infection with 1MOI W-PRV or/and treated with 30 mM and 40 mM NAC for 24 h. Mean fluorescence intensity was measured. F Cells were infected with 1MOI G-PRV or/and treated with 30 mM and 40 mM NAC for 24 h. Viral gB protein level was detected by western blot and viral titers in cellular supernatants were detected by TCID50 assay. Cells were infected with 1MOI G-PRV or/and treated with 40 mM NAC for 18 h and 24 h. G Viral gB protein level was detected by western blot and viral titers in cellular supernatants were detected by TCID50 assay. H MAVS protein level was detected by western blot. I IFN-β, IFIT1, ISG15 mRNA levels were detected by qRT-PCR. *, **, and *** indicate statistically significant differences with P < 0.05, P < 0.01, and P < 0.001, respectively.
Figure 2
Figure 2
Effects of NAC on mitochondrial membrane potential and morphology. Cells were infected with 1MOI W-PRV or/and treated with 40 mM NAC for 18 h and 24 h. AB MMP was detected by flow cytometry using the JC-1 probe. The counts of cells whose MMP (Q3 area) was depolarized were quantitated. C, D Mitochondrial network morphology (TOM20 labeled, red) was observed by confocal microscopy. The proportion of cells whose mitochondria manifested fragments were quantitated. Cells were infected with 1MOI G-PRV or/and treated with 40 mM NAC for 18 h and 24 h. E MFN1, MFN2, OPA1, Drp1, p-Drp1(s616) and gB protein levels were detected by western blot. F p-PINK1(Ser228), p-Parkin (Ser65), TOM20, COX4, p62, LC3 and gB protein levels were detected by western blot. * and *** indicate statistically significant differences with P < 0.05 and P < 0.001, respectively. ns indicates not statistically significant.
Figure 3
Figure 3
Role of AMPK-ULK1 signaling pathway on PRV-induced mitophagy and viral replication. A-B Cells were infected with 1MOI G-PRV for 6, 12, 18, and 24 hpi (left) or 0.1, 1, 5 MOI G-PRV for 18 h (right). AMPK, p-AMPK(Thr172), mTOR, p-mTOR (Ser2448), p-ULK1(Ser 555), ULK1 and gB protein levels were detected by western blot (C) Cells were infected with G-PRV or treated with UV-PRV (equivalent of MOI = 1) at 12, 18, and 24 hpi. AMPK, p-AMPK(Thr172), p-ULK1(Ser 555), ULK1 and gB protein levels were detected by western blot. D-E p-AMPK (Thr 172) and AMPK protein levels in mitochondrial and cytoplasmic lysates were analyzed by western blot upon G-PRV infection (MOI = 1) at 12, 18, and 24 hpi or 0.1, 1, 5 MOI G-PRV for 18 h. Cells were infected with 1MOI G-PRV or/and treated with dorsomorphin (30 µM) for 18 and 24 h. F AMPK, p-AMPK(Thr172), p62, LC3-II protein levels, TOM20 and COX4 levels were detected by western blot. H Viral gB protein level was detected by western blot. Viral titers in cellular supernatants were detected by TCID50 assay. Cells were transfected siRNA (negative control, NC and siAMPK) for 24 h and then infected with 1 MOI G-PRV for 18 h and 24 h. G Knockdown efficiency of AMPK was determined by western blot (upper). p62, LC3-II, TOM20 and COX4 protein levels were detected by western blot (below). I The gB protein levels and viral titers in cellular supernatants were determined by western blot and TCID50, respectively. Cells were infected with 1MOI G-PRV or/and treated with 40 mM NAC for 18 h and 24 h. J AMPK, p-AMPK(Thr172), p-ULK1(Ser 555), ULK1 and gB protein levels were detected by western blot. **, and *** indicate statistically significant differences with P < 0.01, and P < 0.001, respectively.
Figure 4
Figure 4
Role of mitochondrial calcium on PRV-induced increased ROS levels and mitochondria damage. A Colocalization of mitochondria (TOM20, red) with ER (calnexin, green) was visualized by confocal microscopy. B-E Cells were infected with 1MOI W-PRV for 12, 18, and 24 hpi (upper) or 0.1, 1, 5 MOI G-PRV for 12 h (below). mtCa2+ was detected by flow cytometry using Rhod-2AM probe and mean fluorescence intensity was measured. Cells were infected with 1MOI W-PRV or/and treated with 5 µM or 10 µM MCU-i4 for 18 h. F-G mtCa2+ levels were detected by flow cytometry using Rhod-2AM probe and mean fluorescence intensity was measured. H-I MMP was detected by flow cytometry using the JC-1 probe. The counts of cells whose MMP (Q3 area) was depolarized were quantitated. (J-K) ROS levels were detected by flow cytometry using DCFH-DA probe and mean fluorescence intensity was measured. L-M Mitochondrial network morphology (TOM20 labeled, red) was observed by confocal microscopy. The proportion of cells whose mitochondria manifested fragments were quantitated. N AMPK, p-AMPK(Thr172), p-ULK1(ser 555) and ULK1 protein levels were detected by western blot. O-P The gB protein levels and viral titers in cellular supernatants were determined by western blot and TCID50, respectively. *** indicate statistically significant differences with P < 0.001, respectively.
Figure 5
Figure 5
PRV infection inhibited the production of Nrf2-mediated antioxidant enzyme. A-B Cells were infected with 1MOI G-PRV for 6, 12, 18 and 24 hpi (left) or 0.1, 1, 5 MOI G-PRV for 24 h (right). Nrf2, Keap1, HO1, NQO1 and GCLC protein levels were detected by western blot. C Cells were infected with G-PRV or treatment with UV-PRV (equivalent of MOI = 1) at 12, 18, and 24 hpi. Nrf2 and Keap1 protein levels were detected by western blot. D-E Cells were infected with 1MOI G-PRV for 6, 12, 18, and 24 hpi (upper) or 0.1, 1, 5 MOI G-PRV for 24 h (below). NFE2L2, HMOX1, NQO1 and GCLC mRNA levels were detected by qRT-PCR. F The subcellar localization of Nrf2 was detected by immunofluorescence upon G-PRV infection (MOI = 1) at 6, 12, 18, and 24 hpi. G-H Nrf2 protein levels in nuclear and cytoplasmic lysates were analyzed by western blot upon G-PRV infection (MOI = 1) at 12, 18, and 24 hpi (upper) or 0.1, 1, 5 MOI G-PRV for 24 h (below). I Cells were treated with different concentrations of SFN for 24 h. Cell viability were detected by CCK-8. J Cells were infected with 1MOI G-PRV or/and treated with 5 µM or 10 µM SFN for 24 h. HO1, NQO1 and gB protein levels were detected by western blot. Viral titers in cellular supernatants were determined by TCID50. *, **, and *** indicate statistically significant differences with P < 0.05, P < 0.01, and P < 0.001, respectively. ns indicates not statistically significant.
Figure 6
Figure 6
Graphical diagram of the role of PRV-increased ROS levels on mitochondria damage, mitophagy and viral replication. PRV infection enhances contact between the ER and mitochondria, leading to mitochondrial calcium overload and ROS production. Additionally, PRV infection sequesters the antioxidative transcription factor Nrf2 in the cytoplasm, impairing ROS clearance and promoting intracellular accumulation. Elevated ROS levels disrupt mitochondrial morphology and function, activating the AMPK-ULK1 axis and triggering PINK1-Parkin-dependent mitophagy. This process degrades damaged mitochondria and MAVS, thereby creating a cellular environment conducive to viral replication.

Similar articles

References

    1. Ha HL, Shin HJ, Feitelson MA, Yu DY (2010) Oxidative stress and antioxidants in hepatic pathogenesis. World J Gastroenterol 16:6035–6043 - PMC - PubMed
    1. Nencioni L, Sgarbanti R, De Chiara G, Garaci E, Palamara AT (2007) Influenza virus and redox mediated cell signaling: a complex network of virus/host interaction. New Microbiol 30:367–375 - PubMed
    1. Protto V, Tramutola A, Fabiani M, Marcocci ME, Napoletani G, Iavarone F, Vincenzoni F, Castagnola M, Perluigi M, Di Domenico F, De Chiara G, Palamara AT (2020) Multiple herpes simplex virus-1 (HSV-1) reactivations induce protein oxidative damage in mouse brain: novel mechanisms for Alzheimer’s disease progression. Microorganisms 8:972 - PMC - PubMed
    1. Hu J, Li H, Luo X, Li Y, Bode A, Cao Y (2017) The role of oxidative stress in EBV lytic reactivation, radioresistance and the potential preventive and therapeutic implications. Int J Cancer 141:1722–1729 - PubMed
    1. Sun W, Liu S, Yan Y, Wang Q, Fan Y, Okyere SK (2023) Pseudorabies virus causes splenic injury via inducing oxidative stress and apoptosis related factors in mice. Sci Rep 13:23011 - PMC - PubMed

MeSH terms

Substances

LinkOut - more resources