

Reductions in Respiratory Hospital Visits after a Coal Coking Plant Closure: A Natural Experiment
- PMID: 40691837
- PMCID: PMC12618997
- DOI: 10.1164/rccm.202410-2005OC
Reductions in Respiratory Hospital Visits after a Coal Coking Plant Closure: A Natural Experiment
Abstract
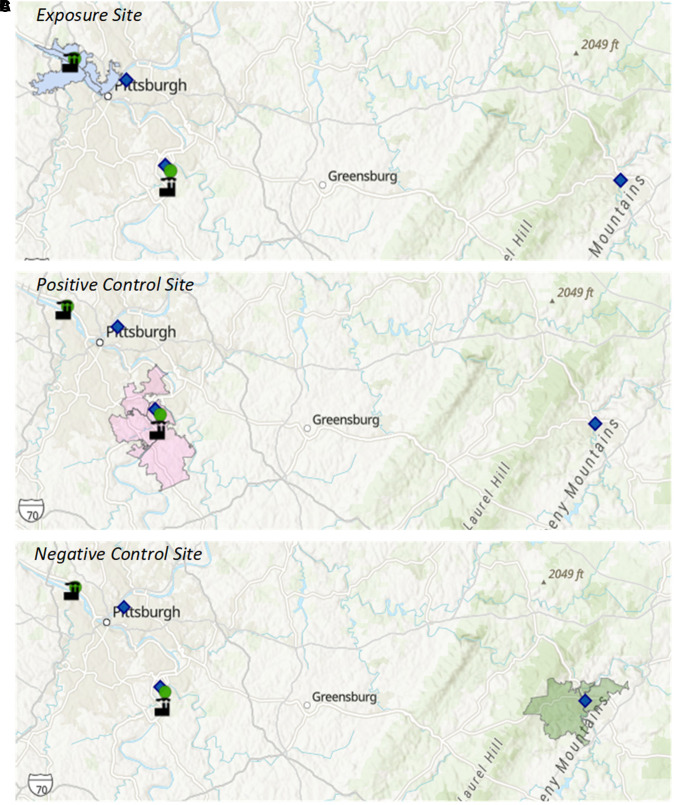
Rationale: Abrupt air quality improvements have followed the closure or dramatic emission control of large air pollution sources. These "natural experiments" provide ideal opportunities to assess the real-world health benefits of air quality improvements. The shutdown of the Shenango coking plant, a significant fossil-fuel pollution source located on an island in the Ohio River near Pittsburgh, Pennsylvania, presented such an opportunity to test for changes in respiratory health in the local community after the closure. Objectives: We sought to identify and quantify the immediate and/or longer term changes in respiratory hospitalizations and emergency department (ED) visits among the population residing near the Shenango coke plant at the time of its closure. Methods: We acquired data for respiratory hospitalizations and ED visit counts from residents living in zip codes surrounding the plant, as well as at comparison control sites, 3 years before and after the shutdown date. The immediate and longer term changes of respiratory health outcomes were tested with an interrupted time series model and compared with findings from external control sites and internal control outcomes. Measurements and Main Results: We found that the closure of the Shenango plant was associated with an immediate 20.5% (95% confidence interval = 12.8-27.6) decrease for weekly respiratory ED visits and an immediate 41.2% (95% confidence interval = 14.4-59.9) decrease in ED visits for pediatric asthma, followed by an additional 4% per-month longer term downward trend. Longer term reductions, as compared with preclosure trends, were also observed for hospitalizations for chronic obstructive pulmonary disease. Conclusions: Our study provides strong confirmation that reductions in fossil-fuel-related air pollution produce both short-term and longer term respiratory health benefits.
Keywords: COPD; air pollution; asthma; interrupted time series analysis.
Figures


Comment in
-
Natural Experiments: An Efficient Tool for Population Respiratory Health Evaluation.Am J Respir Crit Care Med. 2025 Nov;211(11):1986-1988. doi: 10.1164/rccm.202505-1137ED. Am J Respir Crit Care Med. 2025. PMID: 40758580 Free PMC article. No abstract available.
References
-
- Boogaard H, van Erp AM, Walker KD, Shaikh R. Accountability studies on air pollution and health: the HEI experience. Curr Environ Health Rep . 2017;4:514–522. - PubMed
-
- Schraufnagel DE, Balmes JR, De Matteis S, Hoffman B, Kim WJ, Perez-Padilla R. et al. Health benefits of air pollution reduction. Ann Am Thorac Soc . 2019;16:1478–1487. - PubMed
-
- Hoffmann B, Roebbel N, Gumy S, Forastiere F, Brunekreef B, Jarosinska D. et al. Air pollution and health: recent advances in air pollution epidemiology to inform the European Green Deal: a joint workshop report of ERS, WHO, ISEE and HEI. Eur Respir J . 2020;56:2002575. - PubMed
-
- Burns J, Boogaard H, Polus S, Pfadenhauer LM, Rohwer AC, van Erp AM. et al. Interventions to reduce ambient air pollution and their effects on health: an abridged Cochrane systematic review. Environ Int . 2020;135:105400. - PubMed
-
- Bell ML, Morgenstern RD, Harrington W. Quantifying the human health benefits of air pollution policies: review of recent studies and new directions in accountability research. Environ Sci Policy . 2011;14:357–368.
MeSH terms
Substances
Grants and funding
LinkOut - more resources
Full Text Sources
Medical
