. 2025 Jul 21;16(1):392.
doi: 10.1186/s13287-025-04489-x.

AKT signaling upregulates BDNF expression in induced neural stem cells that interact with microglia

Affiliations

AKT signaling upregulates BDNF expression in induced neural stem cells that interact with microglia

Wenjia Wang et al. Stem Cell Res Ther. .

Abstract

Background: Brain-derived neurotrophic factor (BDNF) has the capacity to promote neuronal survival that is crucial to neurological recovery after closed head injury (CHI). We previously reported that intracerebral-transplanted induced neural stem cells (iNSCs) can up-regulate BDNF levels to exert neurotrophic effects in CHI-damaged brains. Here we aim to elucidate the mechanism of BDNF up-regulation in iNSCs.

Methods: We performed iNSC and lipopolysaccharide (LPS)-activated microglia co-culture experiments, iNSC transplantation, loss-of-function study, morphological and molecular biological analyses to uncover the mechanism underlying the overexpression of BDNF in iNSCs.

Results: Our results indicated that co-culture with LPS-activated microglia up-regulated the expression levels of BDNF, as well as Bdnf exons I and IV in iNSCs. Notably, AKT inhibition could counteract the effects of co-culture with LPS-activated microglia that decreased enhancer of zeste homolog 2 (EZH2) and H3K27 trimethylation (H3K27me3) levels at Bdnf promoter IV but increased EZH2 phosphorylation and BDNF expression in iNSCs. Additionally, blockage of AKT could counteract the effects of co-culture with LPS-activated microglia that increased cAMP response element binding protein (CREB) levels at Bdnf promoters I and IV, as well as CREB phosphorylation and BDNF expression in iNSCs. Furthermore, blocking AKT activity in grafted iNSCs could reduce BDNF expression in the injured cortices of CHI mice.

Conclusions: In short, our study shows that AKT signaling may regulate BDNF expression in iNSCs. Activation of AKT can up-regulate BDNF expression through inactivating EZH2 as well as reducing EZH2 and H3K27me3 levels at Bdnf promoter IV, meanwhile activating CREB as well as increasing CREB levels at Bdnf promoters I and IV.

Keywords: AKT; BDNF; CREB; Closed head injury; EZH2; H3K27me3; Induced neural stem cell; Microglia.


Conflict of interest statement

Declarations. Ethics approval and consent to participate: (1) Title of the approved project: Effect and mechanism of induced neural stem cell transplantation in the treatment of brain injury; (2) Name of the institutional approval committee: Research Ethics Committee at Chinese PLA General Hospital; (3) The approval number: 2016-40; (4) The approval date: March 16, 2016. Consent for publication: Not applicable. Competing interests: All authors declare that they have no conflicts of interest.

Figures
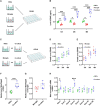
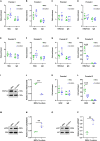
Fig. 1
Fig. 1
Co-culture with LPS-activated microglia up-regulates BDNF expression in iNSCs. (A) Schematic representation of the ELISA design (green dots represent iNSCs; red dots represent LPS-activated microglia). (B) ELISA results showing the levels of BDNF in cell culture supernatants among the three groups at 12, 24 and 48 h after co-culture (n = 6/group; one-way analysis of variance with Tukey’s post hoc test, *P < 0.05, **P < 0.01, ***P < 0.001). (C) Schematic representation of the CCK-8 assay design (green dots represent iNSCs; red dots represent LPS-activated microglia). (D, E) CCK-8 assay results showing the proliferation of iNSCs (D) and microglia (E) between the iNSC or microglia mono-culture and co-culture groups at 12, 24 and 48 h after co-culture (n = 6/group; student’s t-test). (F, G) qRT-PCR assay results showing the levels of Bdnf in iNSCs (F) and microglia (G) between the iNSC or microglia mono-culture and co-culture groups at 24 h after co-culture (n = 6/group; student’s t-test, ***P < 0.001). (H) qRT-PCR assay results showing the levels of Bdnf exons I-VIII in iNSCs between the iNSC mono-culture and co-culture groups at 24 h after co-culture (n = 6/group; student’s t-test, *P < 0.05, ***P < 0.001). Data are presented as mean ± standard deviation. BDNF: brain-derived neurotrophic factor; CCK-8: cell counting Kit-8; ELISA: enzyme linked immunosorbent assay; iNSCs: induced neural stem cells; LPS: lipopolysaccharide; qRT-PCR: quantitative reverse transcription-polymerase chain reaction
Fig. 2
Fig. 2
Co-culture with LPS-activated microglia decreases H3K27me3 and EZH2 levels at Bdnf promoter IV but increases EZH2 phosphorylation in iNSCs (A-D) ChIP assay results showing the levels of histone H3 acetylation (H3Ac; A), H4 acetylation (H4Ac; B), H3K4 trimethylation (H3K4me3; C), and H3K27 trimethylation (H3K27me3; D) at Bdnf promoter I in iNSCs between the iNSC mono-culture and co-culture groups at 24 h after co-culture (n = 6/group; student’s t-test). (E-H) ChIP assay results showing the levels of H3Ac (E), H4Ac (F), H3K4me3 (G), and H3K27me3 (H) at Bdnf promoter IV in iNSCs between the two groups at 24 h after co-culture (n = 6/group; student’s t-test, ***P < 0.001). (I) Representative immunoblots illustrating the levels of H3K27me3 and H3 in iNSCs between the two groups at 24 h after co-culture (full-length blots are presented in Additional Fig. 1). (J) Box-whisker plot depicting the relative levels of H3K27me3/H3 in iNSCs between the two groups at 24 h after co-culture (n = 3/group; student’s t-test, ***P < 0.001). (K, L) ChIP assay results showing the levels of EZH2 at Bdnf promoter I (K) and IV (L) in iNSCs between the two groups at 24 h after co-culture (n = 6/group; student’s t-test, ***P < 0.001). (M) Representative immunoblots illustrating the levels of p-EZH2 and EZH2 in iNSCs between the two groups at 24 h after co-culture (full-length blots are presented in Additional Fig. 1). (N) Box-whisker plot depicting the relative levels of p-EZH2/EZH2 in iNSCs between the two groups at 24 h after co-culture (n = 3/group; student’s t-test, **P < 0.01). (O) Representative immunoblots illustrating the levels of p-AKT and AKT in iNSCs between the two groups at 24 h after co-culture (full-length blots are presented in Additional Fig. 1). (P) Box-whisker plot depicting the relative levels of p-AKT/AKT in iNSCs between the two groups at 24 h after co-culture (n = 3/group; student’s t-test, **P < 0.01). Data are presented as mean ± standard deviation. BDNF: brain-derived neurotrophic factor; ChIP: chromatin immunoprecipitation; EZH2: enhancer of zeste homolog 2; iNSCs: induced neural stem cells
Fig. 3
Fig. 3
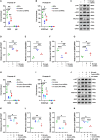
AKT signaling regulates EZH2 phosphorylation, H3K27 trimethylation and BDNF expression in iNSCs. (A, B) ChIP assay results showing the levels of EZH2 (A) and H3K27me3 (B) at Bdnf promoter IV in iNSCs among the iNSC mono-culture, co-culture and co-culture (LY294002; iNSCs pretreated with LY294002) groups at 24 h after co-culture (n = 6/group; one-way analysis of variance with Tukey’s post hoc test, *P < 0.05, **P < 0.01, ***P < 0.001). (C) Representative immunoblots illustrating the levels of p-AKT, AKT, p-EZH2, EZH2, H3K27me3, H3, BDNF and GAPDH in iNSCs among the three groups at 24 h after co-culture (full-length blots are presented in Additional Fig. 2). (D-G) Box-whisker plot depicting the relative levels of p-AKT/AKT (D), p-EZH2/EZH2 (E), H3K27me3/H3 (F), and BDNF/GAPDH (G) in iNSCs among the three groups at 24 h after co-culture (n = 3/group; one-way analysis of variance with Tukey’s post hoc test, *P < 0.05, **P < 0.01, ***P < 0.001). (H, I) ChIP assay results showing the levels of EZH2 (H) and H3K27me3 (I) at Bdnf promoter IV in iNSCs among the iNSC mono-culture, co-culture, co-culture (Control shRNA; iNSCs pretreated with control shRNA), and co-culture (AKT shRNA; iNSCs pretreated with AKT-specific shRNA) groups at 24 h after co-culture (n = 6/group; one-way analysis of variance with Tukey’s post hoc test, *P < 0.05, ***P < 0.001). (J) Representative immunoblots illustrating the levels of p-AKT, AKT, p-EZH2, EZH2, H3K27me3, H3, BDNF and GAPDH in iNSCs among the four groups at 24 h after co-culture (full-length blots are presented in Additional Fig. 3). (K-N) Box-whisker plot depicting the relative levels of p-AKT/AKT (K), p-EZH2/EZH2 (L), H3K27me3/H3 (M), and BDNF/GAPDH (N) in iNSCs among the four groups at 24 h after co-culture (n = 3/group; one-way analysis of variance with Tukey’s post hoc test, *P < 0.05, **P < 0.01, ***P < 0.001). Data are presented as mean ± standard deviation. BDNF: brain-derived neurotrophic factor; ChIP: chromatin immunoprecipitation; EZH2: enhancer of zeste homolog 2; GAPDH: glyceraldehyde 3-phosphate dehydrogenase; iNSCs: induced neural stem cells
Fig. 4
Fig. 4
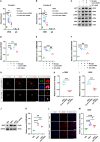
The expression and localization of p-EZH2, H3K27me3 and BDNF in iNSCs. (A) Representative staining for the p-EZH2+ (green) and BDNF+ (red) depicted p-EZH2 and BDNF levels in iNSCs between the co-culture (Control shRNA; iNSCs pretreated with control shRNA), and co-culture (AKT shRNA; iNSCs pretreated with AKT-specific shRNA) groups at 24 h after co-culture. Nuclei were counterstained with DAPI (blue). Scale bar: 50 μm (5 μm in the magnified images). (B, C) Box-whisker plot depicting the relative fluorescence intensity (RFI) values of p-EZH2 (B) and BDNF (C) in iNSCs between the two groups at 24 h after co-culture (n = 6/group; student’s t-test, ***P < 0.001). (D) Representative staining for the H3K27me3+ (green) and BDNF+ (red) depicted H3K27me3 and BDNF levels in iNSCs between the two groups at 24 h after co-culture. Nuclei were counterstained with DAPI (blue). Scale bar: 50 μm (5 μm in the magnified images). (E, F) Box-whisker plot depicting the RFI values of H3K27me3 (E) and BDNF (F) in iNSCs between the two groups at 24 h after co-culture (n = 6/group; student’s t-test, ***P < 0.001). Data are presented as mean ± standard deviation. BDNF: brain-derived neurotrophic factor; EZH2: enhancer of zeste homolog 2; iNSCs: induced neural stem cells
Fig. 5
Fig. 5
Co-culture with LPS-activated microglia increases CREB levels at Bdnf promoters I and IV, as well as CREB phosphorylation in iNSCs. (A, B) ChIP assay results showing the levels of CREB at Bdnf promoter I (A) and IV (B) in iNSCs between the iNSC mono-culture and co-culture groups at 24 h after co-culture (n = 6/group; student’s t-test, ***P < 0.001). (C) Representative immunoblots illustrating the levels of p-CREB and CREB in iNSCs between the two groups at 24 h after co-culture (full-length blots are presented in Additional Fig. 4). (D) Box-whisker plot depicting the relative levels of p-CREB/CREB in iNSCs between the two groups at 24 h after co-culture (n = 3/group; student’s t-test, ***P < 0.001). (E, F) ChIP assay results showing the levels of CREB at Bdnf promoter I (E) and IV (F) in iNSCs among the iNSC mono-culture, co-culture and co-culture (666 − 15; iNSCs pretreated with 666 − 15) groups at 24 h after co-culture (n = 6/group; one-way analysis of variance with Tukey’s post hoc test, *P < 0.05, **P < 0.01, ***P < 0.001). (G) Representative immunoblots illustrating the levels of p-CREB, CREB, BDNF and GAPDH in iNSCs among the three groups at 24 h after co-culture (full-length blots are presented in Additional Fig. 5). (H, I) Box-whisker plot depicting the relative levels of p-CREB/CREB (H) and BDNF/GAPDH (I) in iNSCs among the three groups at 24 h after co-culture (n = 3/group; one-way analysis of variance with Tukey’s post hoc test, *P < 0.05, **P < 0.01, ***P < 0.001). (J, K) ChIP assay results showing the levels of CREB at Bdnf promoter I (J) and IV (K) in iNSCs among the iNSC mono-culture, co-culture, co-culture (Control shRNA; iNSCs pretreated with control shRNA), and co-culture (CREB shRNA; iNSCs pretreated with CREB-specific shRNA) groups at 24 h after co-culture (n = 6/group; one-way analysis of variance with Tukey’s post hoc test, ***P < 0.001). (L) Representative immunoblots illustrating the levels of p-CREB, CREB, BDNF and GAPDH in iNSCs among the four groups at 24 h after co-culture (full-length blots are presented in Additional Fig. 6). (M, N) Box-whisker plot depicting the relative levels of p-CREB/CREB (M) and BDNF/GAPDH (N) in iNSCs among the four groups at 24 h after co-culture (n = 3/group; one-way analysis of variance with Tukey’s post hoc test, ***P < 0.001). Data are presented as mean ± standard deviation. BDNF: brain-derived neurotrophic factor; ChIP: chromatin immunoprecipitation; CREB: cAMP response element binding protein; GAPDH: glyceraldehyde 3-phosphate dehydrogenase; iNSCs: induced neural stem cells
Fig. 6
Fig. 6
AKT signaling regulates BDNF expression by recruiting CREB to their promoters I and IV in iNSCs. (A, B) ChIP assay results showing the levels of CREB at Bdnf promoter I (A) and IV (B) in iNSCs among the iNSC mono-culture, co-culture, co-culture (Control shRNA; iNSCs pretreated with control shRNA), and co-culture (AKT shRNA; iNSCs pretreated with AKT-specific shRNA) groups at 24 h after co-culture (n = 6/group; one-way analysis of variance with Tukey’s post hoc test, *P < 0.05, **P < 0.01, ***P < 0.001). (C) Representative immunoblots illustrating the levels of p-AKT, AKT, p-CREB, CREB, BDNF and GAPDH in iNSCs among the four groups at 24 h after co-culture (full-length blots are presented in Additional Fig. 7). (D-F) Box-whisker plot depicting the relative levels of p-AKT/AKT (D), p-CREB/CREB (E), and BDNF/GAPDH (F) in iNSCs among the four groups at 24 h after co-culture (n = 3/group; one-way analysis of variance with Tukey’s post hoc test, **P < 0.01, ***P < 0.001). (G) Representative staining for the p-CREB+ (green) and BDNF+ (red) depicted p-CREB and BDNF levels in iNSCs between the co-culture (Control shRNA; iNSCs pretreated with control shRNA), and co-culture (AKT shRNA; iNSCs pretreated with AKT-specific shRNA) groups at 24 h after co-culture. Nuclei were counterstained with DAPI (blue). Scale bar: 50 μm (5 μm in the magnified images). (H, I) Box-whisker plot depicting the relative fluorescence intensity (RFI) values of p-CREB (H) and BDNF (I) in iNSCs between the two groups at 24 h after co-culture (n = 6/group; student’s t-test, ***P < 0.001). (J) Representative immunoblots illustrating the levels of BDNF and GAPDH in the injured cortices among the PBS (CHI mice receiving PBS), iNSC (CHI mice receiving iNSCs pretreated with PBS), and iNSC (AKT shRNA; CHI mice receiving iNSCs pretreated with AKT-specific shRNA) groups on day 7 post-CHI (full-length blots are presented in Additional Fig. 8). (K) Box-whisker plot depicting the relative levels of BDNF/GAPDH in the injured cortices among the three groups on day 7 post-CHI (n = 3/group; one-way analysis of variance with Tukey’s post hoc test, *P < 0.05, **P < 0.01, ***P < 0.001). (L) Representative staining for the BDNF+ (red) depicted BDNF levels in the injured cortices among the three groups on day 7 post-CHI. Nuclei were counterstained with DAPI (blue). Scale bar: 50 μm. (M) Box-whisker plot depicting the RFI values of BDNF in the injured cortices among the three groups on day 7 post-CHI (n = 6/group; one-way analysis of variance with Tukey’s post hoc test, *P < 0.05, ***P < 0.001). Data are presented as mean ± standard deviation. BDNF: brain-derived neurotrophic factor; CHI: closed head injury; ChIP: chromatin immunoprecipitation; CREB: cAMP response element binding protein; GAPDH: glyceraldehyde 3-phosphate dehydrogenase; iNSCs: induced neural stem cells

Similar articles

References

    1. Maas AIR, Menon DK, Manley GT, Abrams M, Åkerlund C, Andelic N, Aries M, Bashford T, Bell MJ, Bodien YG, Brett BL, Büki A, Chesnut RM, Citerio G, Clark D, Clasby B, Cooper DJ, Czeiter E, Czosnyka M, Dams, Connor K, et al. Traumatic brain injury: progress and challenges in prevention, clinical care, and research. Lancet Neurol. 2022;21(11):1004–60. - PMC - PubMed
    1. Bielefeld P, Martirosyan A, Martín-Suárez S, Apresyan A, Meerhoff GF, Pestana F, Poovathingal S, Reijner N, Koning W, Clement RA, Van der Veen I, Toledo EM, Polzer O, Durá I, Hovhannisyan S, Nilges BS, Bogdoll A, Kashikar ND, Lucassen PJ, Belgard TG, et al. Traumatic brain injury promotes neurogenesis at the cost of astrogliogenesis in the adult hippocampus of male mice. Nat Commun. 2024;15(1):5222. - PMC - PubMed
    1. Lindhout FW, Krienen FM, Pollard KS, Lancaster MA. A molecular and cellular perspective on human brain evolution and tempo. Nature. 2024;630(8017):596–608. - PubMed
    1. Chaker Z, Segalada C, Kretz JA, Acar IE, Delgado AC, Crotet V, Moor AE, Doetsch F. Pregnancy-responsive pools of adult neural stem cells for transient neurogenesis in mothers. Science. 2023;382(6673):958–63. - PubMed
    1. Wyart C, Carbo-Tano M, Cantaut-Belarif Y, Orts-Del’Immagine A, Böhm UL. Cerebrospinal fluid-contacting neurons: multimodal cells with diverse roles in the CNS. Nat Rev Neurosci. 2023;24(9):540–56. - PubMed

MeSH terms

Substances

LinkOut - more resources