

Non-random aggregations of healthy and unhealthy lifestyles and their population characteristics - pattern recognition in a large population-based cohort
- PMID: 40691847
- PMCID: PMC12281871
- DOI: 10.1186/s13690-025-01678-1
Non-random aggregations of healthy and unhealthy lifestyles and their population characteristics - pattern recognition in a large population-based cohort
Abstract
Background: There is currently no consensus on the number and domains of lifestyle factors to incorporate in research examining lifestyle combinations. A common approach in this field involves creating unweighted lifestyle scores by summing healthy/unhealthy lifestyle scores. However, further exploration and comparison are needed to advance beyond simple summation and investigate more nuanced lifestyle patterns.
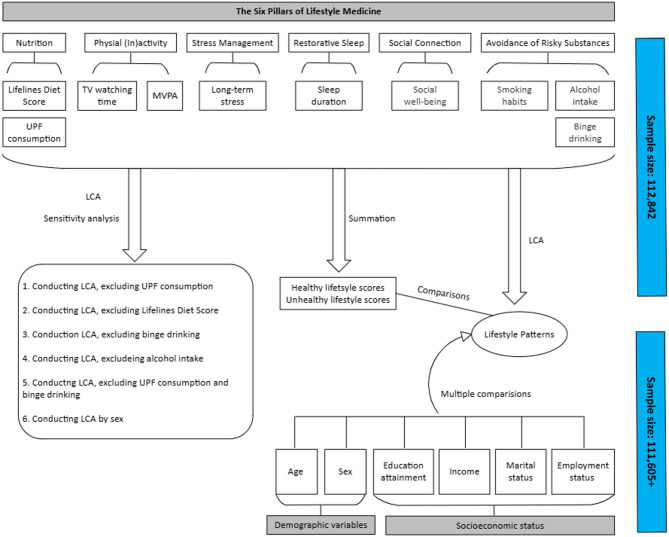
Methods: Latent class analysis was performed to identify lifestyle patterns among 112,842 participants aged 18 or older from the Dutch Lifelines cohort (baseline data, collected from 2007 to 2013). Ten lifestyle factors were selected based on the six pillars of Lifestyle Medicine: smoking habits, binge drinking, daily alcohol intake, diet quality, ultra-processed food consumption, long-term stress, physical (in)activity, sleeping, TV watching time and social connections. Lifestyle factors were assessed using validated self-report questionnaires.
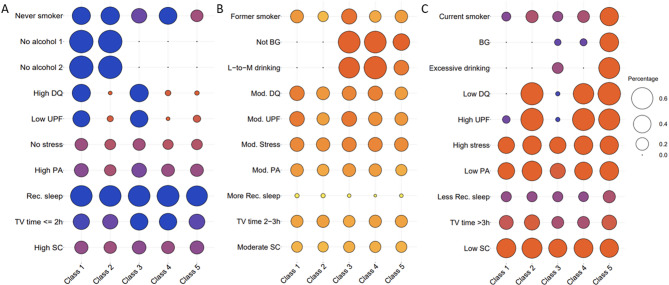
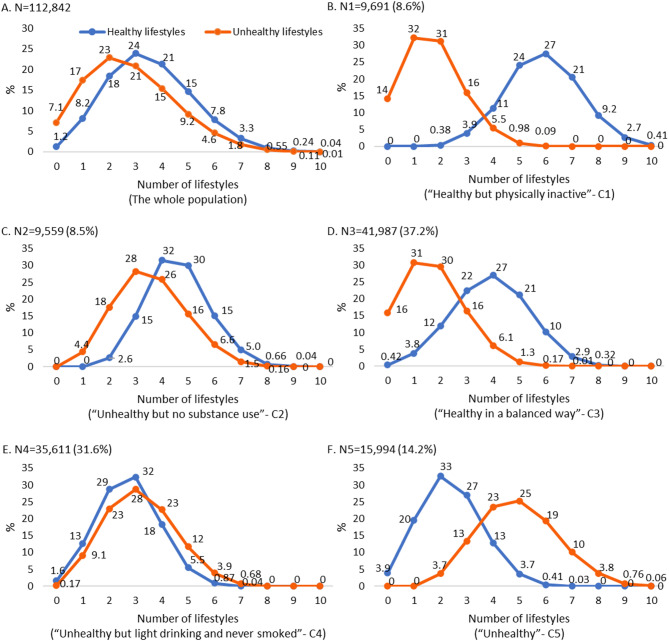
Results: We identified five lifestyle patterns: “Healthy but physically inactive” (8.6% of the total population, class 1), “Unhealthy but no substance use” (8.5%, class 2), “Healthy in a balanced way” (37.2%, class 3), “Unhealthy but light drinking and never smoked” (31.6%, class 4) and “Unhealthy” (14.2%, class 5). Socio-demographic characteristics including age distribution, sex, education level, income and employment status differed significantly (nominal p < 0.05) across lifestyle patterns. Multiple comparison analysis showed that healthy lifestyle scores differed within lifestyle pattern pairs. Proportions of unhealthy lifestyle scores are comparable between the “Healthy but physically inactive” and the “Healthy in a balanced way” patterns as well as the “Unhealthy but no substance use” and “Unhealthy but light drinking and never smoked” patterns.
Conclusion: The five identified lifestyle patterns exhibit distinct, non-random clustering of behaviours, each linked to specific socio-demographic characteristics. Understanding these clustering tendencies can help identify target populations and uncover barriers to unhealthy behaviours, aiding the development of tailored health interventions. The overlap in the distribution of unhealthy lifestyle scores between two lifestyle patterns suggests that the latter may provide a more comprehensive perspective on habitual behaviours.
Supplementary Information: The online version contains supplementary material available at 10.1186/s13690-025-01678-1.
Keywords: Combined lifestyle factors; Healthy lifestyle scores; Lifestyle clusters; Lifestyle medicine; Tailored lifestyle intervention.
Conflict of interest statement
Declarations. Ethics approval and consent to participate: All participants in Lifelines cohort provided signed informed consent before entry. The Lifelines Cohort Study is conducted according to the principles of the Declaration of Helsinki and in accordance with the research code of the University Medical Center Groningen (UMCG). The Lifelines protocol was approved by the UMCG Medical ethical committee under number 2007/15. Consent for publication: Not applicable. Competing interests: The authors declare no competing interests. Conflict of interest: The authors declare that they have no conflict of interests.
Figures
Similar articles
-
Trajectories of healthy lifestyle index and prediabetes risk of adult workers in Japan.Commun Med (Lond). 2025 Jun 20;5(1):240. doi: 10.1038/s43856-025-00971-y. Commun Med (Lond). 2025. PMID: 40542103 Free PMC article.
-
Combined lifestyle, childhood trauma and depressive symptoms in adults with subthreshold depression: a prospective cohort study.Epidemiol Psychiatr Sci. 2025 Jul 15;34:e39. doi: 10.1017/S2045796025100127. Epidemiol Psychiatr Sci. 2025. PMID: 40660782 Free PMC article.
-
Effectiveness of socioecological model-guided, smart device-based, and self-management-oriented lifestyle (3SLIFE) intervention on healthy lifestyles and metabolic syndrome risk in community residents: a cluster-randomized controlled trial.BMC Med. 2025 May 28;23(1):302. doi: 10.1186/s12916-025-04135-6. BMC Med. 2025. PMID: 40437540 Free PMC article. Clinical Trial.
-
Combined lifestyle factors and metabolic syndrome risk: a systematic review and meta-analysis.Int J Obes (Lond). 2025 Feb;49(2):226-236. doi: 10.1038/s41366-024-01671-8. Epub 2024 Nov 8. Int J Obes (Lond). 2025. PMID: 39516361
-
Lifestyle Quality Indices and Female Breast Cancer Risk: A Systematic Review and Meta-Analysis.Adv Nutr. 2023 Jul;14(4):685-709. doi: 10.1016/j.advnut.2023.04.007. Epub 2023 Apr 20. Adv Nutr. 2023. PMID: 37085092 Free PMC article.
References
-
- World Health Organization. Noncommunicable Diseases (NCD). https://www.who.int/data/gho/data/themes/topics/topic-details/GHO/ncd-mo.... Accessed 2 July 2025.
LinkOut - more resources
Full Text Sources
