. 2025 Oct;12(39):e05214.
doi: 10.1002/advs.202505214. Epub 2025 Jul 21.

Targeting eRNA-Producing Super-Enhancers Regulates TNFα Expression and Mitigates Chronic Inflammation in Mice and Patient-Derived Immune Cells

Affiliations

Targeting eRNA-Producing Super-Enhancers Regulates TNFα Expression and Mitigates Chronic Inflammation in Mice and Patient-Derived Immune Cells

Minjeong Cho et al. Adv Sci (Weinh). 2025 Oct.

Abstract

Chronic inflammatory diseases are driven by immune cell dysregulation and overproduction of pro-inflammatory molecules, such as tumor necrosis factor alpha (TNFα). Super-enhancers (SEs) and their enhancer RNAs (eRNAs) are critical gene expression regulators and offer therapeutic potential beyond protein-targeting approaches. This work hypothesizes that targeting eRNAs could reduce chronic inflammation by modulating TNFα expression. This work generates TNF-9 knockout (KO) mice by deleting a Tnfα-regulating enhancer region. These mice exhibit significantly reduced Tnfα levels, improved disease outcomes, and diminished immune cell activation in models of rheumatoid arthritis (RA), psoriasis, and lipopolysaccharide (LPS)-induced sepsis. Integrative epigenomic and transcriptomic analysis identify additional LPS-responsive, eRNA-producing enhancers as therapeutic targets. Antisense oligonucleotide (ASO)-mediated knockdown of TNF-9 eRNA in mouse macrophages demonstrate decreased Tnfα expression and alleviated RA symptoms. Furthermore, ASO-mediated inhibition of the eRNA of the human homolog of TNF-9 similarly reduce TNFα levels. These findings support eRNA-targeted interventions as potential treatment for chronic inflammatory diseases.

Keywords: antisense oligonucleotide; chronic inflammation; enhancer RNA; rheumatoid arthritis; tumor necrosis factor alpha.


Conflict of interest statement

The authors declare no conflict of interest.

Figures
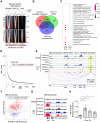
Figure 1
Figure 1
Characterization of the Tnfα SE and eRNA in Response to LPS Stimulation in Mouse BMDMs. A) Heatmaps showing H3K27ac and P300 signal enrichment in LPS‐specific SEs from public datasets, used to identify active enhancer regions. B) Venn diagram illustrating the overlap between LPS‐activated enhancers at 6 h, LPS‐induced TAPEs at 1 h, and LPS‐activated SEs at 6 h. C) Functional enrichment analysis of Gene Ontology Biological Process (GOBP) terms for ABC‐ranked target genes associated with early (1 h) and late (6 h) LPS‐induced enhancers. D) Ranking plot of stitched SEs based on H3K27ac ChIP‐seq signal intensity. The TNF‐9 region (chr17_35209593‐35210594), highlighted in red, ranks at the ninth most prominent enhancer. E) Genome browser tracks showing the Tnfα SE located at chr17:35209593‐35210594 (TNF‐9), with elevated H3K27ac and P300 signals upon LPS treatment, indicating strong enhancer activation. F) Mean‐average (MA) plot of differential expression analysis of transcriptionally active putative enhancers (TAPEs) between UT and LPS‐stimulated conditions. G) RNA‐seq and CUT&RUN genome browser tracks showing increased eRNA transcription from the TNF‐9 region in BMDMs following 1 h of LPS treatment. H) Expression levels of TNF‐9 eRNA in BMDMs following LPS stimulation.
Figure 2
Figure 2
Deletion of TNF‐9 Impairs Tnfα Expression in Myeloid Cells. A) RNA‐seq peaks visualized using the Integrative Genome Viewer, highlighting the TNF‐9 region. B) Volcano plot comparing coding regions between LPS‐treated WT and TNF‐9 KO cells, highlighting DEGs. C) Tnfα expression changes after 1 h of LPS treatment in BMDMs. normalized to Gapdh. D) Representative flow cytometry plots showing a significant reduction in CD11b+ Tnfα+ cells in TNF‐9 KO mice compared to WT (left). Quantification of the percentage of CD11b+ Tnfα+ cells in BMDMs WT and TNF‐9 KO mice after LPS stimulation, shown as a bar graph (right). E) Tnfα and Il6 levels in culture supernatants from LPS‐stimulated BMDMs derived from WT and TNF‐9 KO mice. F) Percentage of CD11b+ Tnfα+ cells in LPS‐stimulated BM. Representative flow cytometry plots show a significant reduction in TNF‐9 KO mice compared to WT. G) Gating strategy used to identify specific populations, including Ly6C+ monocytes (Population I) and Ly6C+Ly6G+ neutrophils (Population II). The percentage of Tnfα+ cells was analyzed within each population and compared WT and TNF‐9 KO mice. H) Tnfα and Il6 mRNA expression in BM from WT and TNF‐9 KO mice. I) Tnfα and Il6 levels in culture supernatants from LPS‐stimulated BM from WT and TNF‐9 KO mice. All data are presented as mean ± standard error of the mean (SEM). Statistical significance was determined using Student's t‐test (*p < 0.05, **p < 0.01, and ***p < 0.001).
Figure 3
Figure 3
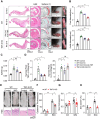
Deletion of the TNF‐9 Region Alleviates RA. A) Comparison of arthritis severity in AIA mouse models among WT, TNF‐9 KO, and WT mice treated with anti‐TNF. Representative hematoxylin and eosin staining and Safranin O staining of joint tissues in AIA mice at 10 day post‐induction. B) Measurements of foot diameter and ankle diameters in different mouse groups. C) Measurement of spleen weight in different mouse groups. D) Tnfα and Il6 levels in synovial fluid. E) Comparison of psoriasis symptoms between WT and TNF‐9 KO mice, assessed histologically. F,G) Measurement of epidermal and skin thickness. H) Flow cytometric analysis of CD45+ immune cell populations in the skin. Scale bars are indicated below each image. Data are presented as mean ± SEM. Statistical significance was determined using Student's t‐test (*p < 0.05, **p < 0.01, and ***p < 0.001).
Figure 4
Figure 4
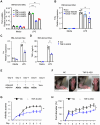
ASO‐Mediated Targeting of TNF‐9 eRNA Reduces Tnfα Expression. A) TNF‐9 eRNA expression following treatment with three different ASOs targeting TNF‐9 eRNA. B) Dose‐dependent effect of ASO2 concentration on Tnfα expression. C) Ltα expression in LPS‐treated BMDMs after ASO2 treatment. D) Tnfα levels in culture supernatants from LPS‐treated BMDMs after ASO2 treatment. E) Schematic of the AIA mouse model timeline and key experimental steps, including treatment administration, sample collection, and analysis points. F–H) Arthritic scores and foot diameter measurements in RA‐induced mice treated with ASO2. Data are presented as mean ± SEM. Statistical significance was determined using Student's t‐test (**p < 0.01 and ***p < 0.001).
Figure 5
Figure 5
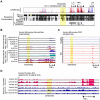
Comprehensive Analysis of the TNFα Enhancer Region, DHS44500, in Human Monocyte‐Derived Macrophages and Samples from Patients with RA. A) UCSC Genome Browser view showing CAGE‐seq data and Multiz Alignments of 100 Vertebrates, illustrating homology and sequence conservation. B) ChIP‐seq analysis of H3K4me3, H2Bub, H4ac, and H3K27ac in human monocyte‐derived macrophages before and after LPS treatment. C) ATAC‐seq data comparing chromatin accessibility at DHS44500 in monocytes from patients with RA and healthy controls. D) Total RNA‐seq and H3K27ac ChIP‐seq analysis of skin tissues from patients with psoriasis and healthy controls. The DHS44500 region is highlighted in a fluorescent yellow in all panels.
Figure 6
Figure 6
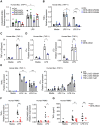
ASO Targeting of DHS44500 eRNA Modulates TNFα Expression in Human Cells. A) THP‐1 cells were electroporated with three candidate ASOs targeting DHS44500 eRNA, followed by LPS stimulation to induce cytokine expression. The expression level of DHS44500 eRNA was subsequently measured. B) Knockdown efficiency and dose‐dependent effects of ASO2 treatment were assessed by quantifying TNFα mRNA expression. C,D) Protein levels of TNFα (C) and LTα and LTβ (D) were evaluated following ASO2 treatment to determine its impact on cytokine expression. E) BMDMs were electroporated with ASOs targeting the TNFα coding region. After 24 h, the cells were stimulated with LPS for 1 and 3 h. The expression of TNFα and LTα was quantified. F) PBMCs were treated with ASO2 targeting DHS44500 eRNA to assess TNFα and DHS44500 expression. G) TNFα protein levels in PBMC culture supernatants after ASO2 treatment (n = 10). Data are presented as mean ± SEM. Statistical significance was determined using Student's t‐test (*p < 0.05, **p < 0.01, and ***p < 0.001).
Figure 7
Figure 7
Evolutionarily Conserved SE‐Associated eRNAs Mediate LPS‐Induced Transcriptional Responses in Human and Mouse Monocytes. A) Volcano plot of differentially expressed eRNAs from TAPE analysis of human iPSM RNA‐seq data, comparing LPS‐stimulated and unstimulated conditions. The DHS44500 region (chr6:31568053‐31569553) is highlighted. B) Ranking plot of stitched SEs based on H3K27ac ChIP‐seq signal intensity in human PBMC‐derived monocytes. The DHS44500 region is highlighted. C) Venn diagram showing the overlap between human monocyte‐derived SEs and human iPSM‐derived TAPEs. D) Functional enrichment analysis of GOBP terms for ABC‐ranked target genes associated with human LPS‐responsive eRNA‐producing enhancer with SE features. E) Venn diagram illustrating the overlap of target genes between human and mouse LPS‐responsive TAPEs with SE features. F) Pathway enrichment analysis of GOBP terms for shared target genes of human and mouse LPS‐responsive TAPEs with SE features. G–H) Comparative analysis of LECIF scores for LPS‐responsive TAPEs with SE features versus GC‐matched random sequences in the hg38 (G) and mm10 (H) genomes.
Figure 8
Figure 8
Graphical abstract of the super‐enhancer eRNA‐targeting therapeutic strategy for inflammatory diseases. Illustration of the regulatory role of SE‐associated eRNAs in controlling TNFα expression in murine and human immune cells. ChIP‐seq and RNA‐seq analyses identify TNF‐9 (mouse) and DHS44500 (human) as key SE that drive TNFα transcription. ASO therapy effectively suppresses TNFα expression by targeting these eRNAs and disrupting enhancer‐promoter interactions. Dysregulation of these eRNAs is implicated in inflammatory diseases, including psoriasis, sepsis, and RA. In RA patients, PBMCs stimulated with LPS show elevated expression of DHS44500 eRNA and TNFα, and ASO‐mediated knockdown of DHS44500 eRNA reduces TNFα levels. These findings establish eRNA‐targeted interventions as a promising therapeutic approach for chronic inflammatory diseases.

References

    1. Caldwell B. A., Li L., J. Leukoc. Biol. 2024, 115, 589. - PMC - PubMed
    1. Meng Y., Nerlov C., Trends Cell Biol. 2024, 35, 217. - PMC - PubMed
    1. Belver L., Albero R., Ferrando A. A., Trends Immunol. 2021, 42, 418. - PMC - PubMed
    1. Eagle K., Jiang Y., Shi X., Li M., Obholzer N. D., Hu T., Perez M. W., Koren J. V., Kitano A., Yi J. S., Lin C. Y., Nakada D., Cell Stem Cell 2022, 29, 650. - PMC - PubMed
    1. Yuan X.‐Q., Zhou N., Wang J.‐P., Yang X.‐Z., Wang S., Zhang C.‐Y., Li G.‐C., Peng L., Mol. Ther. 2023, 31, 1756. - PMC - PubMed

Substances

LinkOut - more resources