

Domestication Reduces Plant Immune Receptor Gene Repertoires Across Lineages
- PMID: 40692513
- PMCID: PMC12342797
- DOI: 10.1093/gbe/evaf147
Domestication Reduces Plant Immune Receptor Gene Repertoires Across Lineages
Abstract
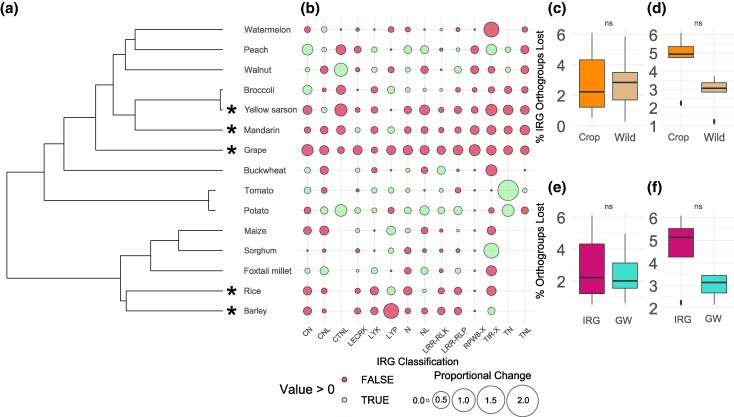
Plant domestication is sometimes associated with a reduction in the diversity of immune receptor genes, critical for pathogen recognition and defense. Yet, the extent and evolutionary forces driving this pattern remain unclear. Using a comparative genomics framework, we analyzed the immune receptor gene repertoires of 15 domesticated crop species and their wild relatives, representing nine plant families. We examined both cell surface pattern recognition receptors and intracellular nucleotide-binding leucine-rich repeat receptors. Our results show that five crops-grapes, mandarins, rice, barley, and yellow sarson-exhibited significantly reduced immune receptor gene repertoires compared to their wild counterparts; however, the overall rate of immune receptor gene loss reflected the background rate of gene loss. Despite this, there is a positive association between domestication duration and immune receptor gene loss. Together, these results suggest that domestication imposes a subtle, cumulative pressure, consistent with relaxed selection rather than a strong cost-of-resistance effect. This study provides insights into how domestication impacts plant immunity, with implications for future crop breeding strategies to enhance disease resistance.
Keywords: cost of resistance; crop evolution; evolutionary genomics; gene loss; plant immunity; relaxed selection.
© The Author(s) 2025. Published by Oxford University Press on behalf of Society for Molecular Biology and Evolution.
Figures

Similar articles
-
A pangenome reference of wild and cultivated rice.Nature. 2025 Jun;642(8068):662-671. doi: 10.1038/s41586-025-08883-6. Epub 2025 Apr 16. Nature. 2025. PMID: 40240605 Free PMC article.
-
Solanum pan-genetics reveals paralogues as contingencies in crop engineering.Nature. 2025 Apr;640(8057):135-145. doi: 10.1038/s41586-025-08619-6. Epub 2025 Mar 5. Nature. 2025. PMID: 40044854 Free PMC article.
-
Genomic Characterization of Plant Immune Receptor Genes Reveals the Role of Alfalfa MsRLK725 in Salt Tolerance and Disease Resistance.Phytopathology. 2025 Aug;115(8):924-937. doi: 10.1094/PHYTO-12-24-0408-R. Epub 2025 Jul 31. Phytopathology. 2025. PMID: 40304561
-
Systemic treatments for metastatic cutaneous melanoma.Cochrane Database Syst Rev. 2018 Feb 6;2(2):CD011123. doi: 10.1002/14651858.CD011123.pub2. Cochrane Database Syst Rev. 2018. PMID: 29405038 Free PMC article.
-
Trans-crop applications of atypical R genes for multipathogen resistance.Trends Plant Sci. 2024 Oct;29(10):1103-1112. doi: 10.1016/j.tplants.2024.05.004. Epub 2024 May 28. Trends Plant Sci. 2024. PMID: 38811244 Review.
References
-
- Benjamini Y, Hochberg Y. Controlling the false discovery rate: a practical and powerful approach to multiple testing. J R Stat Soc B (Methodol). 1995:57:289–300. 10.1111/j.2517-6161.1995.tb02031.x. - DOI
-
- Bergelson J, Purrington CB. Surveying patterns in the cost of resistance in plants. Am Nat. 1996:148:536–558. https://www.jstor.org/stable/2463302.
MeSH terms
Substances
Grants and funding
LinkOut - more resources
Full Text Sources
