. 2025 Jul 17:20:9111-9134.
doi: 10.2147/IJN.S530041. eCollection 2025.

Blackberry-Like Doxorubicin Loaded Hyaluronic Acid/Zinc Phthalocyanine Loaded Mesoporous Silica Nanocomposites for Long-Term Tumor Photodynamic and Chemotherapy Synergistic Therapy

Affiliations

Blackberry-Like Doxorubicin Loaded Hyaluronic Acid/Zinc Phthalocyanine Loaded Mesoporous Silica Nanocomposites for Long-Term Tumor Photodynamic and Chemotherapy Synergistic Therapy

Shangting Du et al. Int J Nanomedicine. .

Abstract

Background: The co-loading of zinc phthalocyanine (ZnPc) and doxorubicin (DOX) on a nanocarrier for tumor photodynamic therapy (PDT)-chemotherapy (CT) synergistic therapy is an effective approach. However, significant differences in water solubility between DOX and ZnPc hinder their high drug-loading content within a unified carrier. Additionally, DOX's systemic toxicity limits its therapeutic dosage, while low ZnPc loading shortens PDT duration, collectively restricting the efficacy of PDT and related synergistic therapy. This study aims to design a long-term PDT and CT synergistic therapy strategy to significantly improve the therapeutic effect and reduce the toxic side effects.

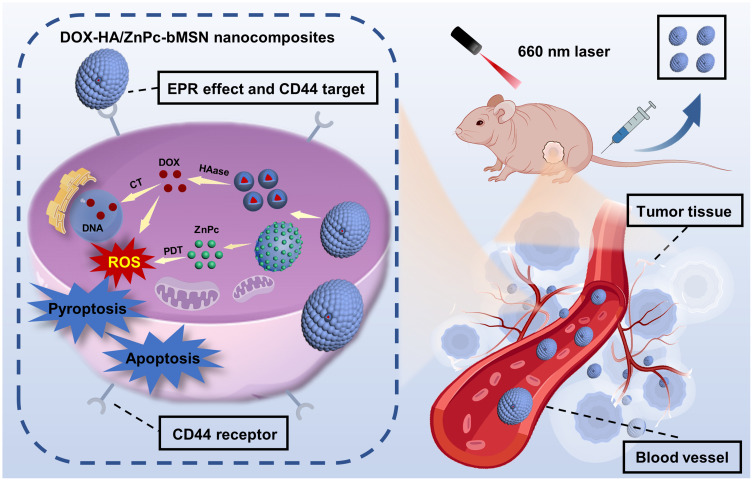
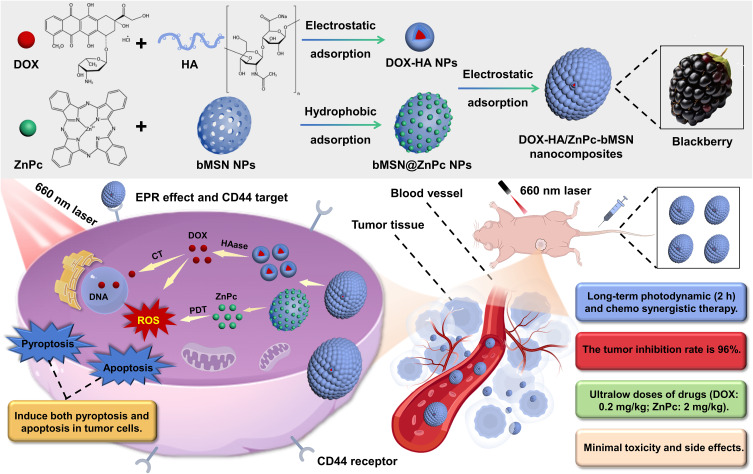
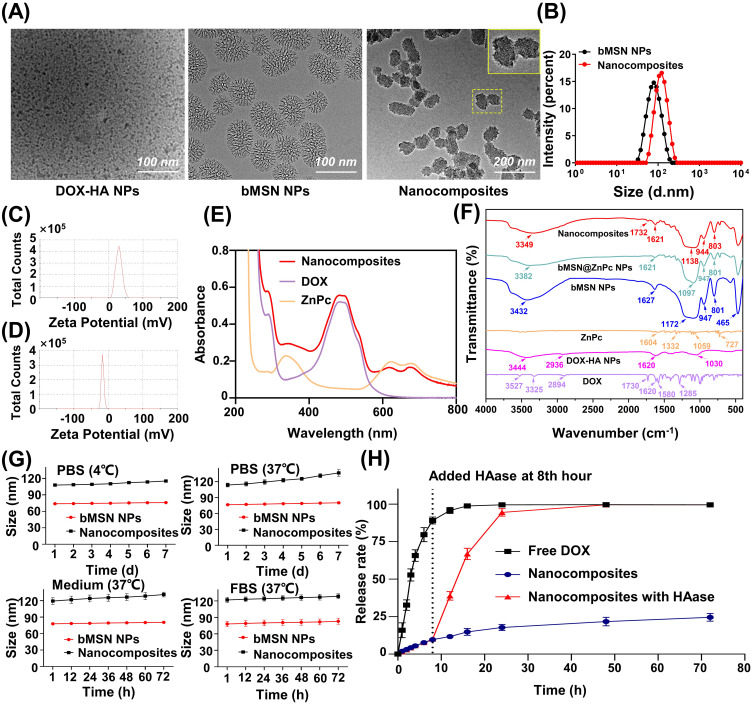
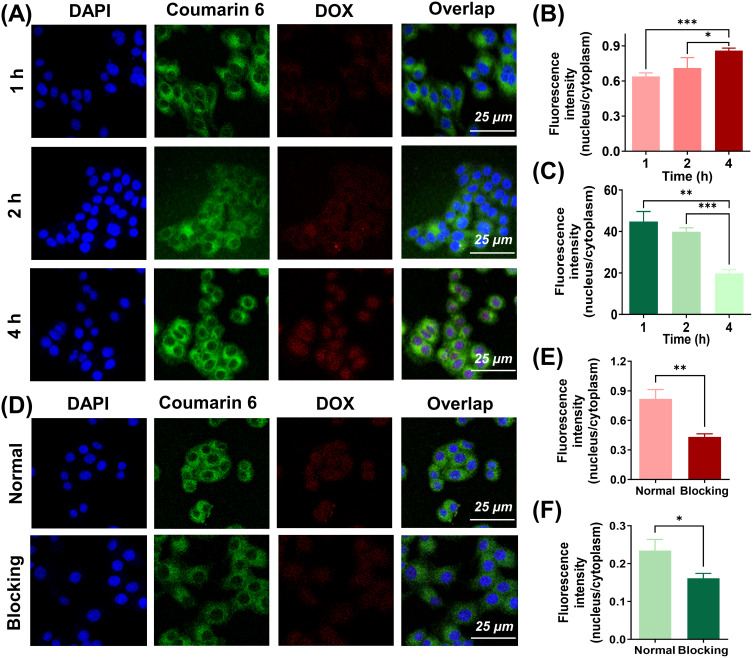
Methods: We encapsulated ZnPc within biodegradable mesoporous silica nanoparticles (bMSN NPs) as the core, followed by electrostatic coating with tumor-targeting, DOX-loaded hyaluronic acid nanoparticles (DOX-HA NPs) to fabricate blackberry-like nanocomposites (DOX-HA/ZnPc-bMSN). In vitro and in vivo experiments determined tumor long-term PDT and CT synergistic therapy efficacy with DOX-HA/ZnPc-bMSN.

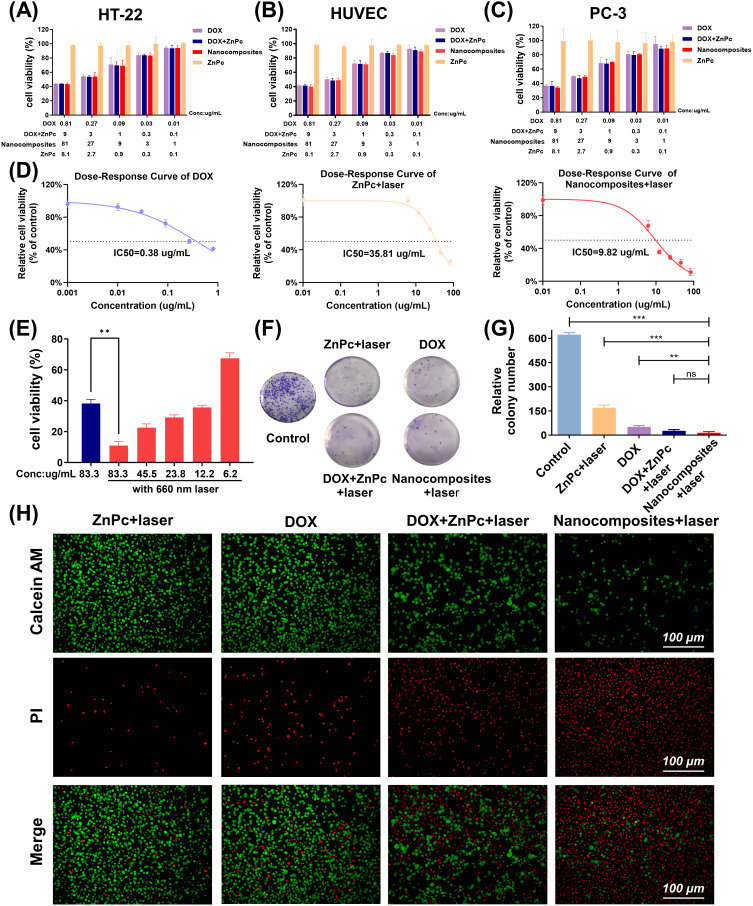
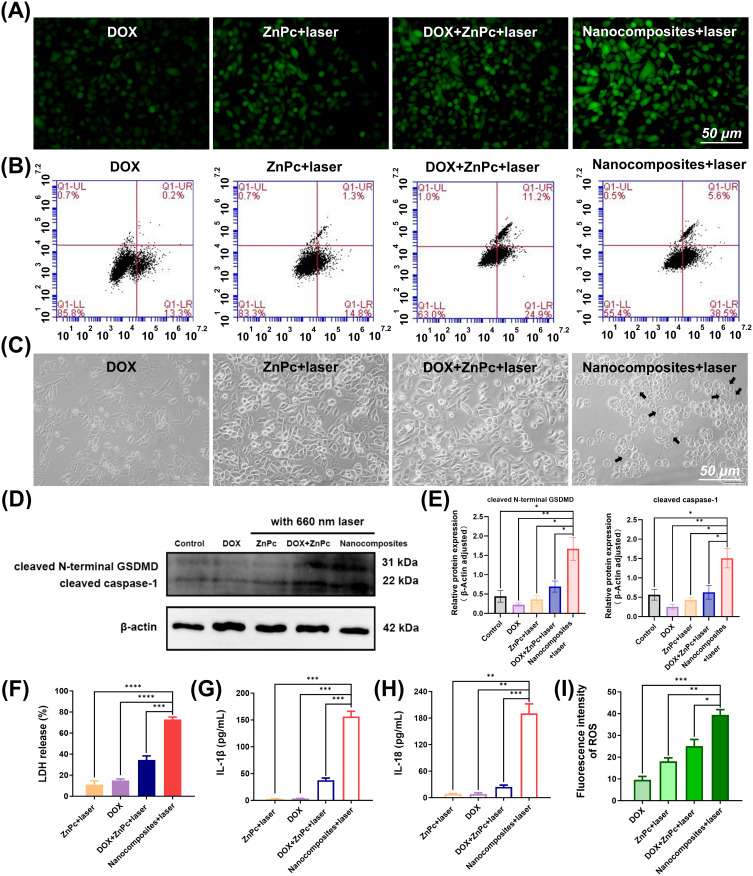
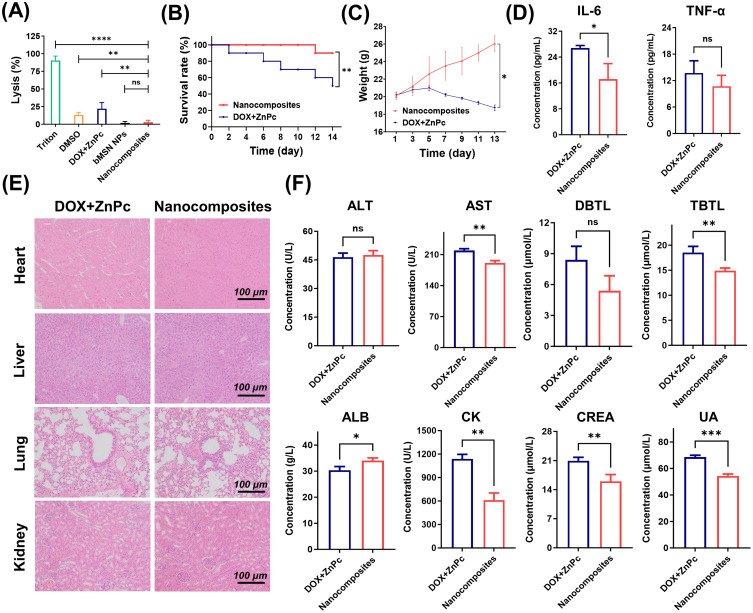
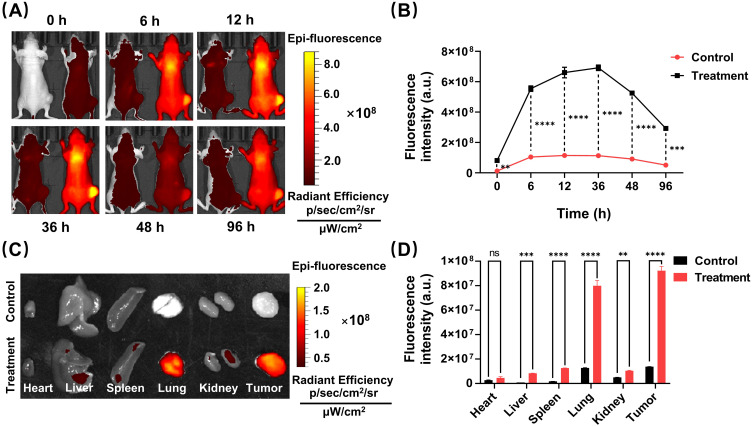
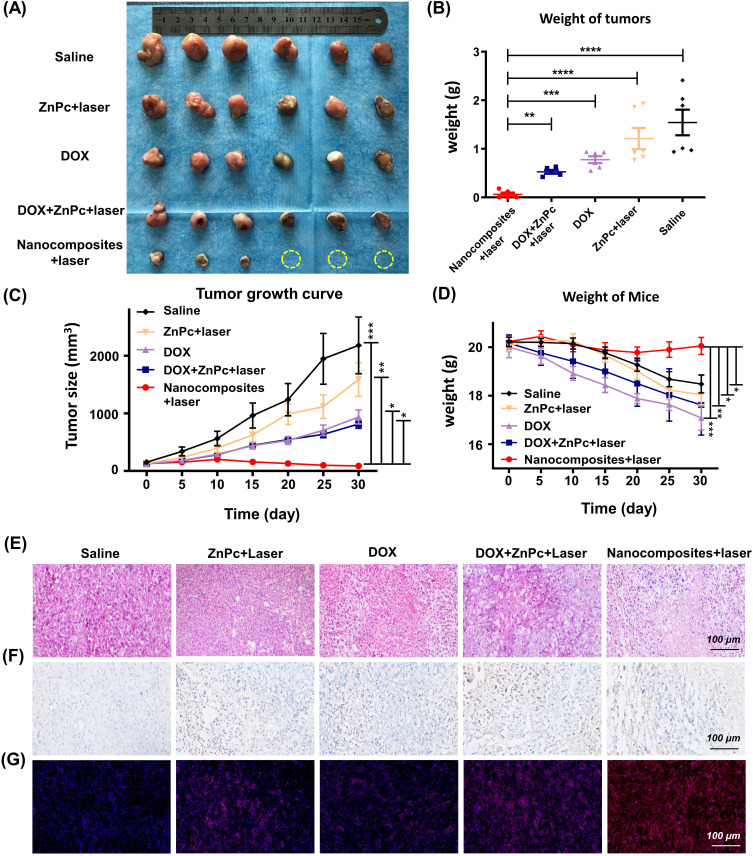
Results: These nanocomposites achieved high ZnPc loading (DLC: 10.2% ± 1.6%) and efficient tumor accumulation, enabling prolonged systemic circulation (> 96 h) and sustained dual-drug release in vivo, realizing long-term photodynamic and CT synergistic therapy. In vitro studies showed a low combination index (CI = 0.26), with reactive oxygen species (ROS) production enhanced by 1.6-fold and 1.9-fold for ZnPc and DOX. The median lethal dose (LD50) of DOX-HA/ZnPc-bMSN nanocomposites (138.95 mg/kg) was 15.12 times higher than that of free DOX. Notably, in vivo studies demonstrated a 96.0% tumor inhibition rate has been achieved using ultralow doses of drugs (DOX: 0.2 mg/kg; ZnPc: 2 mg/kg). This long-term PDT and CT synergistic therapy elevated intracellular ROS levels, which not only induced apoptosis in tumor cells but also activated caspase-1, leading to direct GSDMD cleavage, GSDMD-N release, and pyroptotic tumor cell death.

Conclusion: These nanocomposites dually trigger tumor cell apoptosis/pyroptosis, demonstrating potent therapeutic efficacy and safety for clinical translation.

Keywords: blackberry-like nanocomposites; chemotherapy; mesoporous silica nanoparticles; photodynamic therapy; synergistic therapy.


Conflict of interest statement

The authors report no conflicts of interest in this work.

Figures

None
Graphical abstract
Scheme 1
Scheme 1
Preparation of DOX-HA/ZnPc-bMSN nanocomposites and their long-term photodynamic and related chemotherapy synergistic therapy (the blackberry picture designed by tohamina - Freepik.com https://www.freepik.com).
Figure 1
Figure 1
Characterization of DOX-HA NPs, bMSN NPs, and DOX-HA/ZnPc-bMSN nanocomposites. (A) TEM image of DOX-HA NPs (scale bar, 100 nm), bMSN NPs (scale bar, 100 nm), and DOX-HA/ZnPc-bMSN nanocomposites (scale bar, 200 nm). (B) Particle size distribution of bMSN NPs and DOX-HA/ZnPc-bMSN nanocomposites. (C) Zeta potential of bMSN NPs. (D) Zeta potential of DOX-HA/ZnPc-bMSN nanocomposites. (E) Absorbance spectrum of DOX-HA/ZnPc-bMSN nanocomposites. (F) The IR spectra analysis of DOX, DOX-HA NPs, ZnPc, bMSN NPs, bMSN@ZnPc NPs, and DOX-HA/ZnPc-bMSN nanocomposites. (G) Particle size changes of DOX-HA/ZnPc-bMSN nanocomposites at different temperatures and in different solvents. (H) In vitro release of free DOX, DOX-HA/ZnPc-bMSN nanocomposites, and HAase-containing DOX-HA/ZnPc-bMSN nanocomposites. Data presented as mean ± standard deviation (n = 3).
Figure 2
Figure 2
Cell internalization evaluation of DOX-HA/ZnPc-bMSN nanocomposites. (A) Fluorescence microscopic images of PC-3 cells incubated with fluorescently labeled DOX-HA/ZnPc-bMSN nanocomposites for 1 h, 2 h, and 4 h. (B) Ratio of fluorescence intensity of DOX in the nucleus to the cytoplasm. (C) Ratio of fluorescence intensity of coumarin 6 in the nucleus to the cytoplasm. (D) Fluorescence microscopic images of internalized DOX-HA/ZnPc-bMSN nanocomposites with or without HA blocking. (E) Ratio of fluorescence intensity of DOX in the nucleus to the cytoplasm after internalization of DOX-HA/ZnPc-bMSN nanocomposites with or without HA blocking. (F) Ratio of fluorescence intensity of coumarin 6 in the nucleus to the cytoplasm after internalization of DOX-HA/ZnPc-bMSN nanocomposites with or without HA blocking. Scale bar, 25 μm. Error bars represent the standard deviation of the mean. *p < 0.05, **p < 0.01, ***p < 0.001.
Figure 3
Figure 3
In vitro toxicity of DOX-HA/ZnPc-bMSN nanocomposites. (AC) Cytotoxicity test results of DOX-HA/ZnPc-bMSN nanocomposites on cell lines including HT-22, HUVEC, and PC-3. (D) Dose-response curves of DOX, ZnPc+laser, and DOX-HA/ZnPc-bMSN nanocomposites+laser on the PC-3 cell line. (E) Cell survival rate of PC-3 cells after laser treatment with DOX-HA/ZnPc-bMSN nanocomposites. (F) Results of the clone formation assay of PC-3 cells after treatments. (G) Quantitative data of clone formation assay of PC-3 cells after treatments. (H) Fluorescence microscopic images of live-dead cell staining results of PC-3 cells after treatments. Scale bar, 100 μm. Error bars represent the standard deviation of the mean. **p < 0.01, ***p < 0.001.
Figure 4
Figure 4
Inhibiting efficacy of DOX-HA/ZnPc-bMSN nanocomposites on the proliferation of PC-3 cells. (A) Fluorescence microscopic images of intracellular ROS generation in PC-3 cells after treatments. Scale bar, 50 μm. (B) Flow cytometry analysis of apoptosis in PC-3 cells after treatments. (C) Images of PC-3 cells after treatments. Black allows indicated pyroptotic PC-3 cells with a damaged cell membrane or large bubbles. Scale bar, 50 μm. (D) Western blot experiment to detect the expression of cleaved N-terminal GSDMD and cleaved caspase-1 in PC-3 cells after treatments (n = 3). (E) Quantitative analysis of the expression of cleaved N-terminal GSDMD and cleaved caspase-1 in PC-3 cells after treatments (n = 3). (F) LDH release from PC-3 cells after treatments (n = 3). (G) IL-1β levels in the cell culture supernatant of PC-3 cells after treatments (n = 3). (H) IL-18 levels in the cell culture supernatant of PC-3 cells after treatments (n = 3). (I) Quantitative analysis of intracellular ROS generation fluorescence intensity in PC-3 cells after treatments. Error bars represent the standard deviation of the mean. *p < 0.05, **p < 0.01, ***p < 0.001, ****p < 0.0001.
Figure 5
Figure 5
In vivo toxicity of DOX-HA/ZnPc-bMSN nanocomposites. (A) The hemolysis test results of DOX-HA/ZnPc-bMSN nanocomposites and their main components. (B) The in vivo acute toxicity test results of DOX+ZnPc and DOX-HA/ZnPc-bMSN nanocomposites on the BALB/c mice. (C) Average body weight changes of mice after treatment with DOX+ZnPc and DOX-HA/ZnPc-bMSN nanocomposites. (D) IL-6 and TNF-α in the blood of mice after treatment with DOX+ZnPc and DOX-HA/ZnPc-bMSN nanocomposites (n = 3). (E) The pathological analysis of mice after treatment with DOX+ZnPc and DOX-HA/ZnPc-bMSN nanocomposites. (F) Main blood biochemical indicators of mice after treatment with DOX+ZnPc and DOX-HA/ZnPc-bMSN nanocomposites (n = 3). Error bars represent the standard deviation of the mean. *p < 0.05, **p < 0.01, ***p < 0.001, ****p < 0.0001.
Figure 6
Figure 6
In vivo distribution and target delivery of nanocomposites. (A) The dynamic monitoring of DOX-HA/IR-780-bMSN nanocomposites in the PC-3 tumor-bearing nude mice and the fluorescent signals results of the tumor region. (B) Quantitative analysis of fluorescence signals in the tumor region of PC-3 tumor-bearing nude mice. (C) The residual fluorescent signals result in the organs and tumors of PC-3 tumor-bearing nude mice. (D) Quantitative analysis results of fluorescence signals in major organs and tumor tissues of PC-3 tumor-bearing nude mice. Error bars represent the standard deviation of the mean. **p < 0.01, ***p < 0.001, ****p < 0.0001.
Figure 7
Figure 7
In vivo tumor suppression of DOX-HA/ZnPc-bMSN nanocomposites. (A) All of the remaining tumors after the intervention. Yellow dotted circles indicate completely cured tumors. (B) The tumor weighing results after the intervention (n = 6). (C) The tumor growth curves after the intervention (n = 6). (D) The mean weight changing curve of the mice during the experiment (n = 6). (E) H&E images of tumor tissues after treatments. (F) TUNEL images of tumor tissues after treatments. (G) ROS images of tumor tissues after treatments. Error bars represent the standard deviation of the mean. *p < 0.05, **p < 0.01, ***p < 0.001, ****p < 0.0001.

Similar articles

References

    1. Bray F, Laversanne M, Sung H, et al. Global cancer statistics 2022: GLOBOCAN estimates of incidence and mortality worldwide for 36 cancers in 185 countries. CA Cancer J Clin. 2024;74(3):229–263. doi: 10.3322/caac.21834 - DOI - PubMed
    1. DeVita VT, Chu E. A history of cancer chemotherapy. Cancer Res. 2008;68(21):8643–8653. doi: 10.1158/0008-5472.CAN-07-6611 - DOI - PubMed
    1. Chabner BA, Roberts TG. Timeline: chemotherapy and the war on cancer. Nat Rev Cancer. 2005;5(1):65–72. doi: 10.1038/nrc1529 - DOI - PubMed
    1. Holohan C, Van Schaeybroeck S, Longley DB, Johnston PG. Cancer drug resistance: an evolving paradigm. Nat Rev Cancer. 2013;13(10):714–726. doi: 10.1038/nrc3599 - DOI - PubMed
    1. Wu L, Wang L, Du Y, Zhang Y, Ren J. Mitochondrial quality control mechanisms as therapeutic targets in doxorubicin-induced cardiotoxicity. Trends Pharmacol Sci. 2023;44(1):34–49. doi: 10.1016/j.tips.2022.10.003 - DOI - PubMed

MeSH terms

LinkOut - more resources