

Suppression of Inflammation by Si Miao San in Experimental Rheumatoid Arthritis Through Modulation of the AKT/ROS/Autophagy Axis
- PMID: 40692543
- PMCID: PMC12278982
- DOI: 10.2147/JIR.S524871
Suppression of Inflammation by Si Miao San in Experimental Rheumatoid Arthritis Through Modulation of the AKT/ROS/Autophagy Axis
Abstract
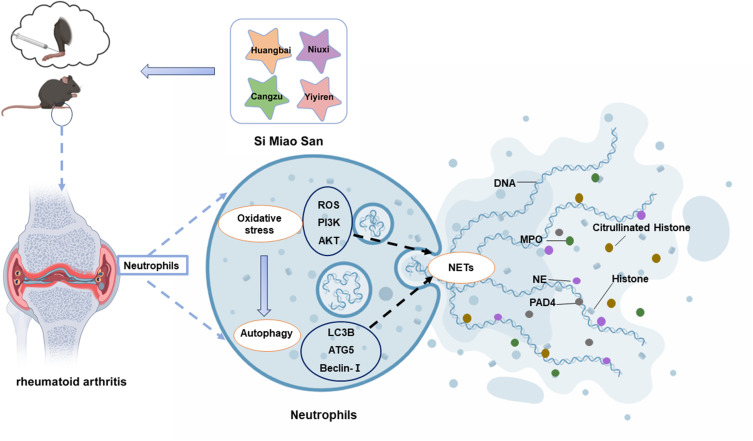
Objective: Si Miao San is effective in ameliorating rheumatoid arthritis (RA) both clinically and experimentally. NETs play a fundamental role in the onset and progression of RA. The goal of this study was to explore the therapeutic effects of Si Miao San (SMS) on adjuvant-induced arthritis in mice and the regulatory mechanisms of NETs both in vivo and in vitro.
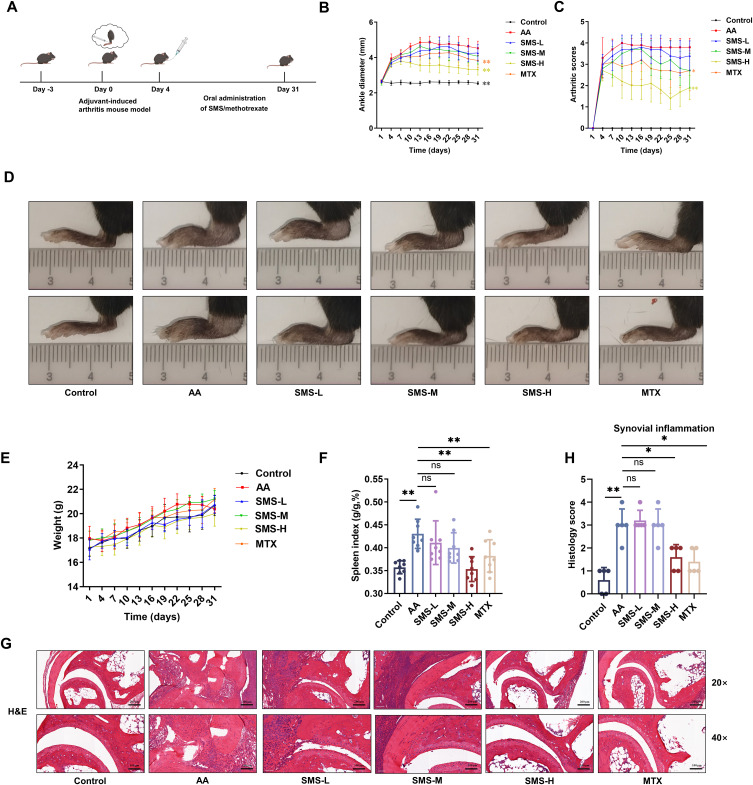
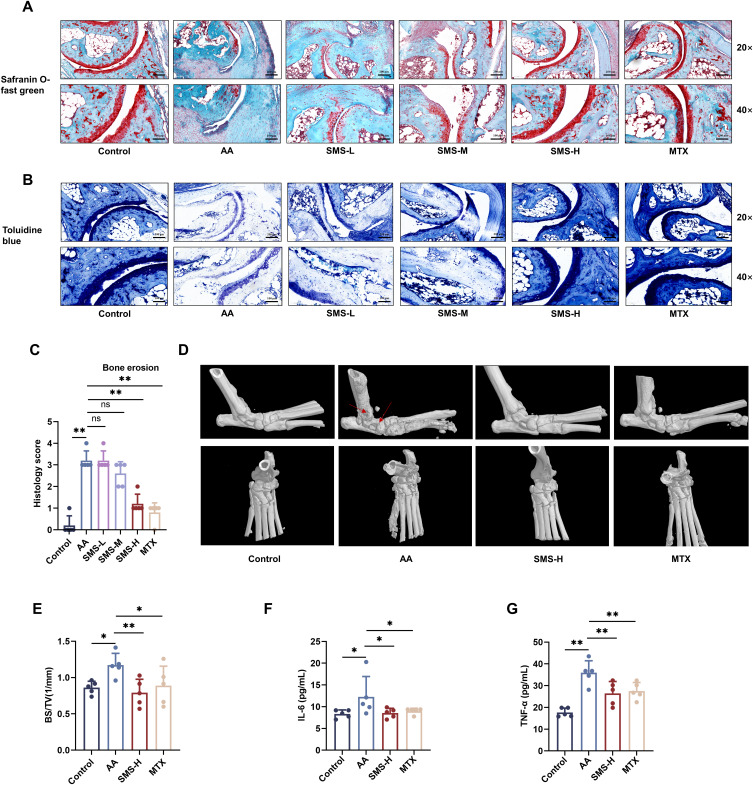
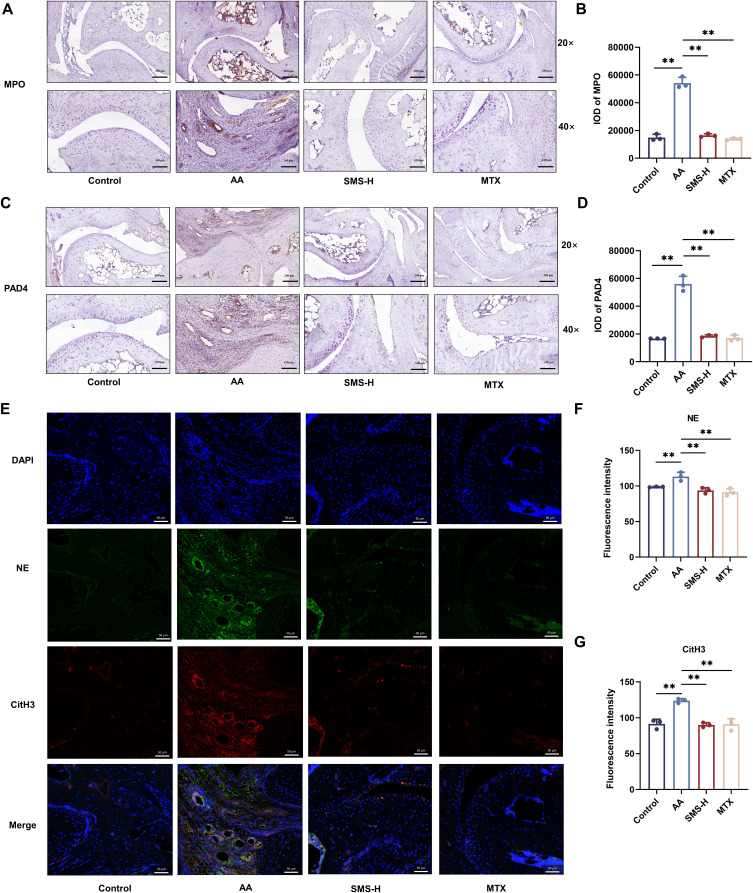
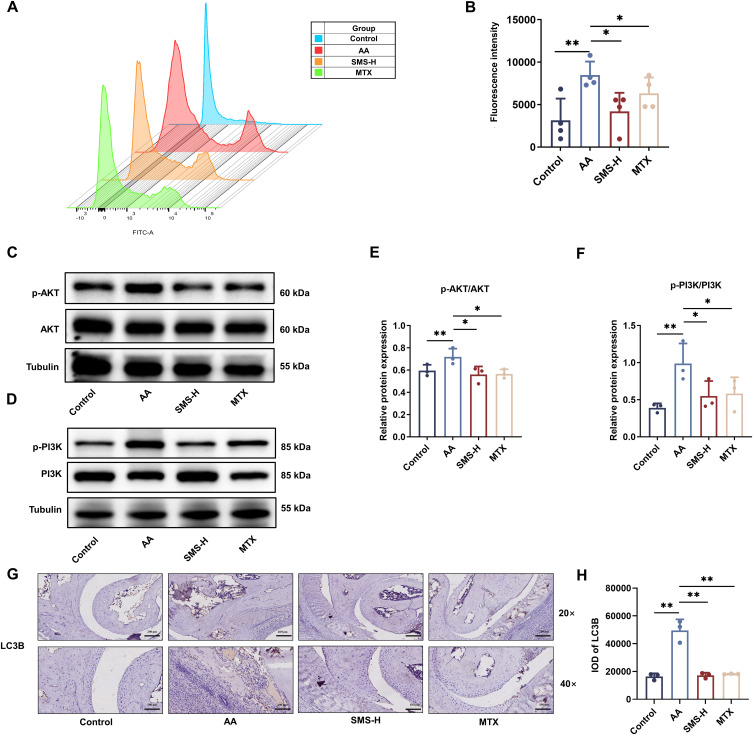
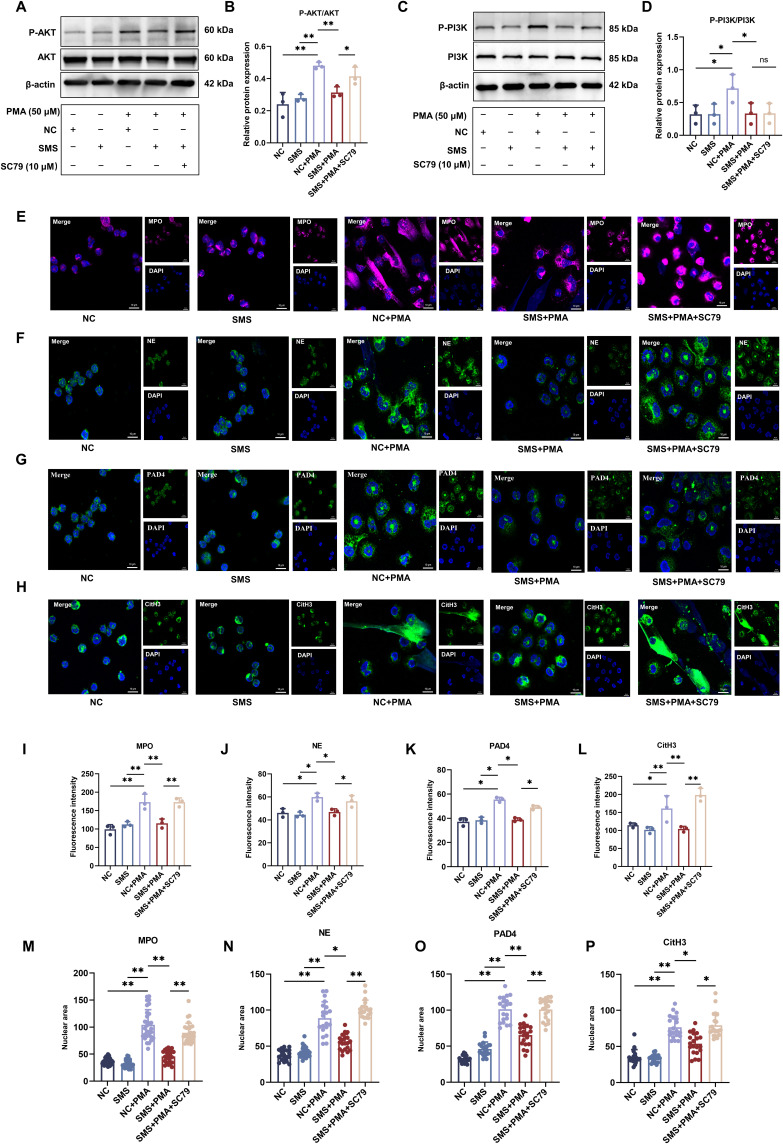
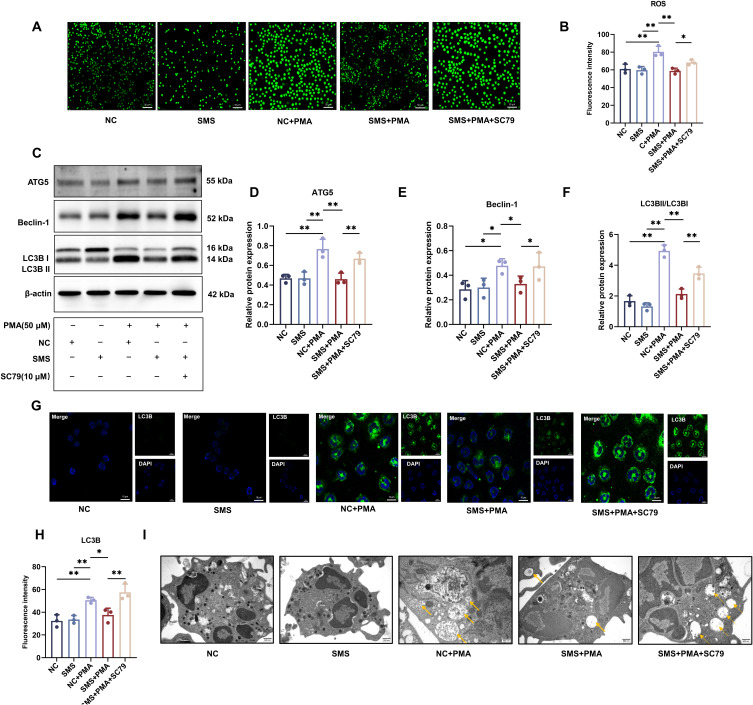
Methods: SMS decoctions were identified using LC-MS/MS analysis and TCMSP. In the adjuvant induced RA murine model, SMS decoction and methotrexate were administered orally. Disease progression was analysed by assessing arthritic scores and joint diameter, H&E staining, safranin O-fast green staining, toluidine blue staining and micro-CT analysis. The expression of NE, MPO, PAD4, LC3B, CitH3, p-AKT and p-PI3K and the production of ROS were detected using IHC, WB and IF analyses. Cytokines in the sera of the mice were detected using cytometric bead arrays. After the in vitro culture of neutrophils, NE, MPO, PAD4, LC3B, CitH3, ROS, p-PI3K and p-AKT were measured using IF and WB analyses. Autophagy was further observed with TEM.
Results: SMS decoction compounds were first identified. Compared with the model group, SMS significantly inhibited joint swelling, inflammation progression and bone destruction. The levels of NE, MPO, PAD4, CitH3, LC3B, ROS production and relative expression of p-AKT and p-PI3K in joint tissues were significantly reduced in the SMS group compared to the model group (P < 0.05). In vitro culture, SMS-containing serum significantly reduced the LC3B-II/LC3B-I ratio and the relative expression levels of p-AKT and p-PI3K, as well as the levels of ROS, NE, MPO, PAD4, and CitH3 compared with those in the PMA-treated group (P < 0.05), which was abolished by the treatment with the AKT activator SC79.
Conclusion: The SMS-induced suppression of inflammation in experimental RA occurred through the modulation of the AKT/ROS/autophagy axis.
Keywords: autophagy; neutrophil extracellular traps; protein kinase B; reactive oxygen species; rheumatoid arthritis.
© 2025 Zhang et al.
Conflict of interest statement
The authors declare that they have no conflict of interest. All authors have read and agreed to the published version of the manuscript.
Figures
Similar articles
-
Er Miao San and its main components phellodendrine and atractylenolide-I exert anti-rheumatoid arthritis effects by inhibiting PAD4 and thereby reducing the formation of NETs.Fitoterapia. 2025 Jul 28;185:106771. doi: 10.1016/j.fitote.2025.106771. Online ahead of print. Fitoterapia. 2025. PMID: 40738459
-
Costunolide Reduces DN Inflammatory Response and Renal Thrombosis by Inhibiting NET Formation.J Diabetes Res. 2025 Jul 17;2025:1159325. doi: 10.1155/jdr/1159325. eCollection 2025. J Diabetes Res. 2025. PMID: 40709100 Free PMC article.
-
[Mechanism of regulating PI3K-Akt signaling pathway and inhibiting chondrocyte apoptosis to improve inflammation levels in rats with knee osteoarthritis by Shenzhuo Decoction].Zhongguo Zhong Yao Za Zhi. 2025 Jun;50(12):3389-3398. doi: 10.19540/j.cnki.cjcmm.20250213.704. Zhongguo Zhong Yao Za Zhi. 2025. PMID: 40686116 Chinese.
-
A systematic review of the effectiveness of adalimumab, etanercept and infliximab for the treatment of rheumatoid arthritis in adults and an economic evaluation of their cost-effectiveness.Health Technol Assess. 2006 Nov;10(42):iii-iv, xi-xiii, 1-229. doi: 10.3310/hta10420. Health Technol Assess. 2006. PMID: 17049139
-
Folic acid and folinic acid for reducing side effects in patients receiving methotrexate for rheumatoid arthritis.Cochrane Database Syst Rev. 2013 May 31;2013(5):CD000951. doi: 10.1002/14651858.CD000951.pub2. Cochrane Database Syst Rev. 2013. PMID: 23728635 Free PMC article.
References
LinkOut - more resources
Full Text Sources
Research Materials
Miscellaneous
