

Subchronic Chlorpyrifos Exposure Induces Thyroid Follicular Cell Pyroptosis to Exacerbate Thyroid Toxicity by Modulating Nrf2/Keap1/NF-κB Pathway in Male Mice
- PMID: 40692545
- PMCID: PMC12277183
- DOI: 10.2147/JIR.S523861
Subchronic Chlorpyrifos Exposure Induces Thyroid Follicular Cell Pyroptosis to Exacerbate Thyroid Toxicity by Modulating Nrf2/Keap1/NF-κB Pathway in Male Mice
Abstract
Purpose: Chlorpyrifos (CPF), a widely used organophosphate pesticide in agriculture, particularly in China, has raised significant environmental and health concerns due to its persistence and bioaccumulation. While CPF-induced toxicity in multiple organ systems has been documented, its long-term impact on thyroid homeostasis and the underlying mechanisms remain poorly understood. This study aimed to investigate the subchronic effects of CPF on thyroid function and elucidate the underlying mechanisms of CPF-induced thyroid toxicity.
Methods: The study utilized 4-week-old male C57BL/6J mice as experimental subjects. These mice were exposed to CPF via intragastric gavage at doses of 3 or 6 mg/kg for a duration of 8 weeks. Throughout the study period, various parameters were assessed, including body weight, serum antioxidant capacity, thyroid endocrine function and structure, apoptosis markers, inflammatory cytokines, and relevant molecular pathways.
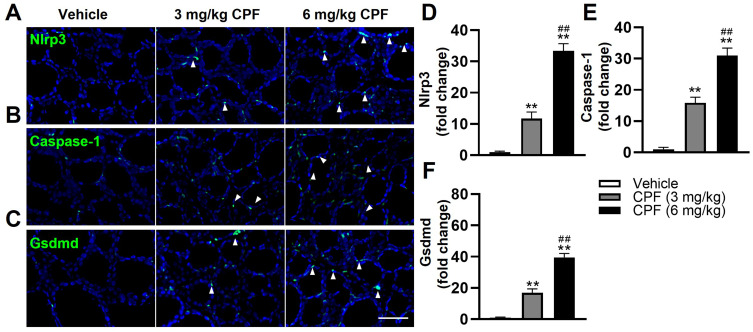
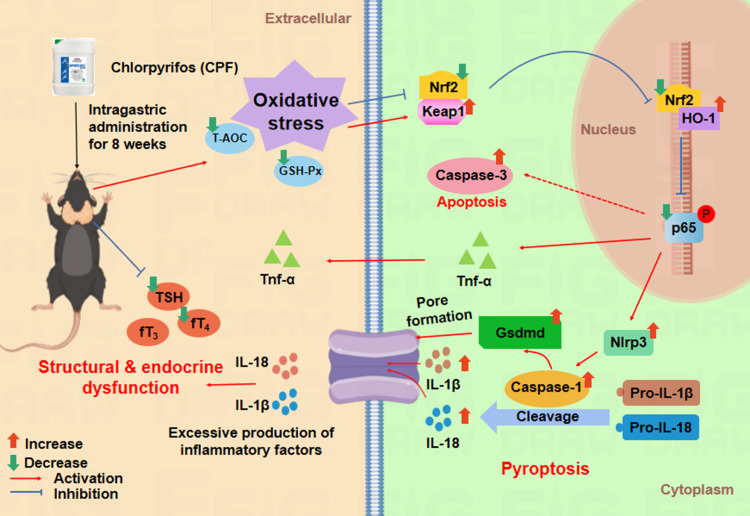
Results: The study revealed that CPF exposure resulted in significant systemic toxicity, manifested through reduced body weight and impaired serum antioxidant capacity. Examination of thyroid-specific effects showed disrupted thyroid endocrine function and structure, accompanied by increased apoptosis and elevated inflammatory cytokines. At the molecular level, CPF significantly stimulated thyroid follicle cell pyroptosis by upregulating the expression of Nlrp3, Caspase-1, and Gsdmd. Further mechanistic analysis demonstrated that CPF activated thyroid follicular cell pyroptosis by modulating the Nrf2/Keap1 antioxidative pathway and enhancing phosphorylation of p65 via NF-κB signaling.
Conclusion: This comprehensive investigation provides novel insights into the mechanisms of CPF-induced thyroid toxicity. The findings demonstrate that CPF exposure compromises thyroid homeostasis through the induction of follicular cell pyroptosis and modulation of the Nrf2/Keap1/NF-κB signaling axis, highlighting the potential health risks associated with CPF exposure and its impact on thyroid function.
Keywords: Nrf2/Keap1/NF-κB pathway; chlorpyrifos; pyroptosis; thyroid follicular cell; thyroid toxicity.
© 2025 Gu et al.
Conflict of interest statement
The authors report no conflicts of interest in this work.
Figures


Similar articles
-
Buzhong Yiqi decoction improves inflammation and oxidative damage in autoimmune thyroiditis by inhibiting apoptosis via the SIRT1-Mediated Nrf2/NF-κB axis.J Ethnopharmacol. 2025 Jul 24;351:119967. doi: 10.1016/j.jep.2025.119967. Epub 2025 May 11. J Ethnopharmacol. 2025. PMID: 40360040
-
Effectiveness of the fruit of Rosa odorata sweet var. gigantea (Coll. et Hemsl.) Rehd. et Wils in the protection and the healing of ethanol-induced rat gastric mucosa ulcer based on Nrf2/NF-κB pathway regulation.J Ethnopharmacol. 2022 Jan 10;282:114626. doi: 10.1016/j.jep.2021.114626. Epub 2021 Sep 10. J Ethnopharmacol. 2022. PMID: 34517064
-
Attenuation of chlorpyrifos-induced liver injury, oxidative stress and inflammation by selenium nanoparticles via SIRT1/FXR/Nrf2 signaling pathway modulation.Naunyn Schmiedebergs Arch Pharmacol. 2025 Jul 23. doi: 10.1007/s00210-025-04465-5. Online ahead of print. Naunyn Schmiedebergs Arch Pharmacol. 2025. PMID: 40699239
-
NTP Developmental and Reproductive Toxicity Technical Report on the Prenatal Development Studies of 2-((1-(4-Phenoxyphenoxy)propan-2-yl)oxy)pyridine (CASRN 95737-68-1) in Sprague Dawley (Hsd:Sprague Dawley® SD®) Rats and New Zealand White (Hra:NZW SPF) Rabbits: DART Report 07 [Internet].Research Triangle Park (NC): National Toxicology Program; 2022 Jan. Research Triangle Park (NC): National Toxicology Program; 2022 Jan. PMID: 35593777 Free Books & Documents. Review.
-
Sertindole for schizophrenia.Cochrane Database Syst Rev. 2005 Jul 20;2005(3):CD001715. doi: 10.1002/14651858.CD001715.pub2. Cochrane Database Syst Rev. 2005. PMID: 16034864 Free PMC article.
References
-
- John EM, Shaike JM. Chlorpyrifos: pollution and remediation. Environ Chem Lett. 2015;13(3):269–291. doi: 10.1007/s10311-015-0513-7 - DOI
-
- Arain M, Brohi M, Channa A, et al. Analysis of chlorpyrifos pesticide residues in surface water, ground water and vegetables through gas chromatography. J Int Environ Appl Sci. 2018;13:167.
LinkOut - more resources
Full Text Sources
