Susceptibility Factor TNF-α Synergizes with Polygonum multiflorum to Drive Idiosyncratic Liver Injury in Mice by Disrupting Gut Microbiota Composition and Hepatic Metabolite Homeostasis
- PMID: 40692546
- PMCID: PMC12278978
- DOI: 10.2147/JIR.S528667
Susceptibility Factor TNF-α Synergizes with Polygonum multiflorum to Drive Idiosyncratic Liver Injury in Mice by Disrupting Gut Microbiota Composition and Hepatic Metabolite Homeostasis
Abstract
Background: Polygonum multiflorum (PM), known as a traditional Chinese herb renowned for its tonic properties, has been used medicinally for millennia. However, it has drawn attention significantly due to the potential to induce idiosyncratic drug-induced liver injury (IDILI) in recent years. Previous studies identified the TNF-α, the pro-inflammatory cytokine, as a key factor contributing to susceptibility to PM induced-IDILI (PM-IDILI). However, the effects by which TNF-α mediates PM-IDILI remain poorly understood.
Methods: This study sought to elucidate the role of TNF-α in PM-IDILI using a TNF-α-sensitized C57BL/6J mouse model, integrating analyses of the gut microbiota and metabolomics We employed biochemical analysis, inflammatory markers, inflammatory liver histopathological, sequencing of 16S rRNA gene, as well as untargeted metabolomics based on LC-MS to systematically evaluate the extent of liver injury and characterize alterations in gut microbiota and liver metabolites following PM administration in TNF-α pre-treated mice.
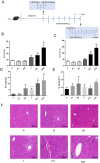
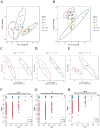
Results: The results demonstrated that PM treatment in TNF-α-sensitized mice significantly elevated levels of indicators as AST (3.6-fold compared to the control group, P < 0.05) and ALT (3.9-fold compared to the control group, P < 0.01), increased plasma levels of IL-6 and IL-1β (P < 0.05 or P < 0.01), induced infiltration of inflammatory cell substantially in the liver. TNF-α-mediated PM disrupted the intestinal microbiota structure, characterized by reduced abundance of Akkermansia and increased abundance of Lachnospiraceae_NK4A136_group, Bacteroides, Alloprevotella, and Blautia. Furthermore, hepatic metabolomics analysis revealed that significant perturbations in TNF-α + PM treated mice, particularly affecting glutathione metabolism, purine metabolism, and arachidonic acid metabolism pathways.
Conclusion: These findings suggest that TNF-α sensitization predisposes mice to PM-IDILI, potentially by disrupting gut microbial homeostasis and altering host hepatic metabolism. This research provides critical theoretical and experimental evidence relevant to the safe and effective clinical application of PM.
Keywords: Polygonum multiflorum; TNF-α; gut microbiota; idiosyncratic drug-induced liver injury; metabolomics; susceptibility.
© 2025 Aimaier et al.
Conflict of interest statement
The authors report no conflicts of interest in this work.
Figures


Similar articles
-
Hydroxysafflor yellow A alleviates oxidative stress and inflammatory damage in the livers of mice with nonalcoholic fatty liver disease and modulates gut microbiota.Front Pharmacol. 2025 Jun 6;16:1568608. doi: 10.3389/fphar.2025.1568608. eCollection 2025. Front Pharmacol. 2025. PMID: 40548050 Free PMC article.
-
Alisol B ameliorated metabolic dysfunction-associated steatotic liver disease via regulating purine metabolism and restoring the gut microbiota disorders.Phytomedicine. 2025 Sep;145:156992. doi: 10.1016/j.phymed.2025.156992. Epub 2025 Jun 22. Phytomedicine. 2025. PMID: 40582207
-
Study on the modulation of kidney and liver function of rats with diabetic nephropathy by Huidouba through metabolomics.J Ethnopharmacol. 2025 Jul 24;351:120136. doi: 10.1016/j.jep.2025.120136. Epub 2025 Jun 11. J Ethnopharmacol. 2025. PMID: 40513925
-
Traditional usages, botany, phytochemistry, pharmacology and toxicology of Polygonum multiflorum Thunb.: a review.J Ethnopharmacol. 2015 Jan 15;159:158-83. doi: 10.1016/j.jep.2014.11.009. Epub 2014 Nov 18. J Ethnopharmacol. 2015. PMID: 25449462 Free PMC article.
-
Systemic pharmacological treatments for chronic plaque psoriasis: a network meta-analysis.Cochrane Database Syst Rev. 2021 Apr 19;4(4):CD011535. doi: 10.1002/14651858.CD011535.pub4. Cochrane Database Syst Rev. 2021. Update in: Cochrane Database Syst Rev. 2022 May 23;5:CD011535. doi: 10.1002/14651858.CD011535.pub5. PMID: 33871055 Free PMC article. Updated.
References
LinkOut - more resources
Full Text Sources

