Time series prediction for monitoring cardiovascular health in autistic patients
- PMID: 40692649
- PMCID: PMC12278423
- DOI: 10.3389/fpsyt.2025.1623986
Time series prediction for monitoring cardiovascular health in autistic patients
Abstract
Introduction: Monitoring cardiovascular health in autistic patients presents unique challenges due to atypical sensory profiles, altered autonomic regulation, and communication difficulties. As cardiovascular comorbidities rise in this population, there is an urgent need for tailored computational strategies to enable continuous monitoring and predictive care planning. Traditional time series methods-including statistical autoregressive models and recurrent neural networks-are constrained by opaque decision processes, limited personalization, and insufficient handling of multimodal data, restricting their utility where transparency and individualized modeling are critical.
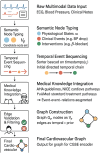
Methods: We introduce a structurally-aware, semantically-grounded framework for time series prediction tailored to cardiovascular trajectories in autistic patients. Our approach departs from black-box modeling by integrating symbolic clinical abstractions, causal event dynamics, and intervention-response coupling within a graph-based paradigm. Central to our method is the CardioGraph Synaptic Encoder (CGSE), a generative model that fuses multimodal data-such as ECG waveforms, blood pressure signals, and structured clinical annotations-into a unified latent space. The CGSE employs dual-level temporal attention to capture patient-specific micro-patterns and population-level structures. To improve generalization and robustness, we propose the Dynamic Cardiovascular Trajectory Alignment (DCTA), which combines task-adaptive curriculum learning with multi-resolution consistency loss.
Results: Our approach effectively addresses challenges such as scarcity of labeled data and clinical heterogeneity common in autistic populations. Experimental results demonstrate that our system significantly outperforms baselines in predictive accuracy, temporal coherence, and interpretability.
Discussion: This work offers a novel, clinically-aligned pipeline for real-time cardiovascular risk monitoring in autistic individuals. By advancing personalized and interpretable healthcare analytics, our method has the potential to support more accurate and transparent decision-making in cardiovascular care pathways for this vulnerable population.
Keywords: autistic patients; cardiovascular health monitoring; graph neural networks; symbolic modeling; time series prediction.
Copyright © 2025 Ma and Lei.
Conflict of interest statement
The authors declare that the research was conducted in the absence of any commercial or financial relationships that could be construed as a potential conflict of interest.
Figures


Similar articles
-
Systemic Inflammatory Response Syndrome.2025 Jun 20. In: StatPearls [Internet]. Treasure Island (FL): StatPearls Publishing; 2025 Jan–. 2025 Jun 20. In: StatPearls [Internet]. Treasure Island (FL): StatPearls Publishing; 2025 Jan–. PMID: 31613449 Free Books & Documents.
-
Short-Term Memory Impairment.2024 Jun 8. In: StatPearls [Internet]. Treasure Island (FL): StatPearls Publishing; 2025 Jan–. 2024 Jun 8. In: StatPearls [Internet]. Treasure Island (FL): StatPearls Publishing; 2025 Jan–. PMID: 31424720 Free Books & Documents.
-
Enhancing Clinical Relevance of Pretrained Language Models Through Integration of External Knowledge: Case Study on Cardiovascular Diagnosis From Electronic Health Records.JMIR AI. 2024 Aug 6;3:e56932. doi: 10.2196/56932. JMIR AI. 2024. PMID: 39106099 Free PMC article.
-
Management of urinary stones by experts in stone disease (ESD 2025).Arch Ital Urol Androl. 2025 Jun 30;97(2):14085. doi: 10.4081/aiua.2025.14085. Epub 2025 Jun 30. Arch Ital Urol Androl. 2025. PMID: 40583613 Review.
-
The Lived Experience of Autistic Adults in Employment: A Systematic Search and Synthesis.Autism Adulthood. 2024 Dec 2;6(4):495-509. doi: 10.1089/aut.2022.0114. eCollection 2024 Dec. Autism Adulthood. 2024. PMID: 40018061 Review.
References
-
- Zhou H, Zhang S, Peng J, Zhang S, Li J, Xiong H, et al. Informer: Beyond efficient transformer for long sequence time-series forecasting. AAAI Conf Artif Intell. (2020) 35(12):11106–1115.
-
- Angelopoulos AN, Candès E, Tibshirani R. Conformal pid control for time series prediction. Neural Inf Process Syst. (2023) 36:23047.
-
- Shen L, Kwok J. Non-autoregressive conditional diffusion models for time series prediction. Int Conf Mach Learn. (2023) 31016–29.
-
- Wen X, Li W. Time series prediction based on lstm-attention-lstm model. IEEE Access. (2023) 11:48322–311.
LinkOut - more resources
Full Text Sources
Research Materials

