[Preprint]. 2024 Dec 22:2024.12.21.629928.
doi: 10.1101/2024.12.21.629928.

SenSet, a novel human lung senescence cell gene signature, identifies cell-specific senescence mechanisms

Affiliations

SenSet, a novel human lung senescence cell gene signature, identifies cell-specific senescence mechanisms

Euxhen Hasanaj et al. bioRxiv. .

Abstract

Cellular senescence is a major hallmark of aging. Senescence is defined as an irreversible growth arrest observed when cells are exposed to a variety of stressors including DNA damage, oxidative stress, or nutrient deprivation. While senescence is a well-established driver of aging and age-related diseases, it is a highly heterogeneous process with significant variations across organisms, tissues, and cell types. The relatively low abundance of senescence in healthy aged tissues represents a major challenge to studying senescence in a given organ, including the human lung. To overcome this limitation, we developed a Positive-Unlabeled (PU) learning framework to generate a comprehensive senescence marker gene list in human lungs (termed SenSet) using the largest publicly available single-cell lung dataset, the Human Lung Cell Atlas (HLCA). We validated SenSet in a highly complex ex vivo human 3D lung tissue culture model subjected to the senescence inducers bleomycin, doxorubicin, or irradiation, and established its sensitivity and accuracy in characterizing senescence. Using SenSet, we identified and validated cell-type specific senescence signatures in distinct lung cell populations upon aging and environmental exposures. Our study presents the first comprehensive analysis of senescent cells in the healthy aging lung and uncovers cell-specific gene signatures of senescence, presenting fundamental implications for our understanding of major lung diseases, including cancer, fibrosis, chronic obstructive pulmonary disease, or asthma.


Figures
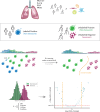
Fig. 1:
Fig. 1:. Schematic illustration of PUc learning for identifying SnCs.
Given a large single-cell lung cohort from young and old individuals (top), we designate cells from young individuals as non-senescent cells (positive). Cells in older individuals are unlabeled initially. We then use positive-unlabeled learning under covariate shift (PUc) to identify SnCs in older individuals (middle). Using these cells, we develop an expression profile for senescence markers in several different cell types (bottom).
Fig. 2:
Fig. 2:. Summary of the Human Lung Cell Atlas.
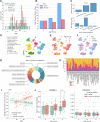
(A) Distribution of donors by age and smoking history. (B) Number of donors by age group and sex. (C) Number of donors broken down by tissue and sampling method (non-smokers). (D-F) UMAP plots describing level 2 cell types, age groups, and sex (NS = non-smoker). (G) Cell type proportion among non-smokers. (H) Age group representation across cell types (NS). (I) Average cell total counts for each donor. (J) Normalized gene expression values for CDKN1A and CDKN2A.
Fig. 3:
Fig. 3:. PUc identified a novel SenSet senescence signature.
(A, left to right) The number and percentage of cells identified as senescent in A; the most frequent genes enriched for most cell types; the total number of SenSet marker genes assigned to a cell type. (for full figures see Supp. Fig. 3–7 or Supp. Tables) (B) Overlap sizes of SenSet with the prior lists. (C) Selected marker genes for some of the cell types and distribution among healthy and SnCs. (D) UMAP plot of senescent cells in A. (E) UMAP plot of cell types assigned at least one marker in A. The cell type numbers for each cluster correspond to the names listed in panel A. (F) Top GO, Jensen, and MSigDB terms enriched for SenSet. (G-H) SenSet genes enriched for basal(−) cells, fibroblasts(−), and type II pneumocytes(−).
Fig. 4:
Fig. 4:. Senescence induction in human PCLS by DNA damage.
(A) PCLS were generated from healthy donors lower left lobe lung with an age range of 20 to 78 years-old. Senescence was induced by treatment with bleomycin (Bleo) at 15mg/mL, or doxorubicin (Doxo) at 0.1μM for 6 days, and PCLS and supernatants were collected. (B) Hematoxylin eosin (H&E) staining on 4μm sliced formalin-fixed paraffin embedded human PCLS at day 6. (C) β-galactosidase staining on whole PCLS at day 6. (D) p21 immunohistofluorescence (IHF) on 4μm sliced formalin-fixed paraffin embedded human PCLS at day 6. (E) p21 positive cells quantification based on p21 IHF staining presented in (D) after bleomycin (n = 7) or doxorubicin (n = 6) treatment. (F) Quantification of p21 protein level by Western blot (WB) after bleomycin (n = 8) or doxorubicin (n = 6) treatment and representative blot. (G) SASP factor, GDF-15, measured by Luminex assay on human PCLS supernatants after bleomycin or doxorubicin treatment (n = 5). Paired t-test: **p < 0.005, *p < 0.05.
Fig. 5:
Fig. 5:. Validation of SenSet.
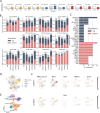
(A) Average total counts per cell across samples and conditions. (B) For each subject, we show the fraction of the genes in each list which were significantly up or downregulated with treatment. (C) SenSet genes up (down)regulated in most samples. (D) UMAP plot of scVI integrated data. (E) Clusters identified using Leiden clustering on scVI embeddings. (F) Normalized expression of CDKN1A and CDKN2A across conditions.
Fig. 6:
Fig. 6:. Cell Type-specific signatures.
(A) For each cell type and gene set, we ran DE tests between the two conditions and show combined p-values (Pearson’s method) for each marker gene. (B-C) Rank sum test statistics for every marker gene and cell type in PCLS *q = 0.05 (for full figures see Supp. Fig. 10-13).
Fig. 7:
Fig. 7:. Comparisons of senescence marker genes between smokers and non-smokers in the HLCA.
(A) Wasserstein distance between the gene expression profiles of smokers and non-smokers across different age groups. Cell types inside the red box exhibited a smaller distance for the pair (young smokers, old non-smokers) when compared to (young smokers, young non-smokers). (B) Fraction of genes enriched in smokers compared to non-smokers among young Y and old A patients for selected cell types.

Similar articles

Cited by

References

    1. Hayflick L. & Moorhead P. S. The serial cultivation of human diploid cell strains. en. Exp. Cell Res. 25, 585–621 (Dec. 1961). - PubMed
    1. Finkel T. & Holbrook N. J. Oxidants, oxidative stress and the biology of ageing. en. Nature 408, 239–247 (Nov. 2000). - PubMed
    1. Campisi J. & d’Adda di Fagagna F. Cellular senescence: when bad things happen to good cells. en. Nat. Rev. Mol. Cell Biol. 8, 729–740 (Sept. 2007). - PubMed
    1. Van Deursen J. M. The role of senescent cells in ageing. en. Nature 509, 439–446 (May 2014). - PMC - PubMed
    1. Huang W., Hickson L. J., Eirin A., Kirkland J. L. & Lerman L. O. Cellular senescence: the good, the bad and the unknown. en. Nat. Rev. Nephrol. 18, 611–627 (Oct. 2022). - PMC - PubMed

Publication types

LinkOut - more resources