. 2025 Jul 7:16:1583620.
doi: 10.3389/fgene.2025.1583620. eCollection 2025.

Identification and validation of DNA methylation-driven gene OSR1 as a novel tumor suppressor for the diagnosis and prognosis of breast cancer

Affiliations

Identification and validation of DNA methylation-driven gene OSR1 as a novel tumor suppressor for the diagnosis and prognosis of breast cancer

Jian Xu et al. Front Genet. .

Abstract

Introduction: Aberrant DNA methylation plays a critical role in the initiation and progression of cancer, yet its association with breast cancer remains inadequately defined. This study aims to clarify the link between methylation-driven genes and breast cancer pathogenesis.

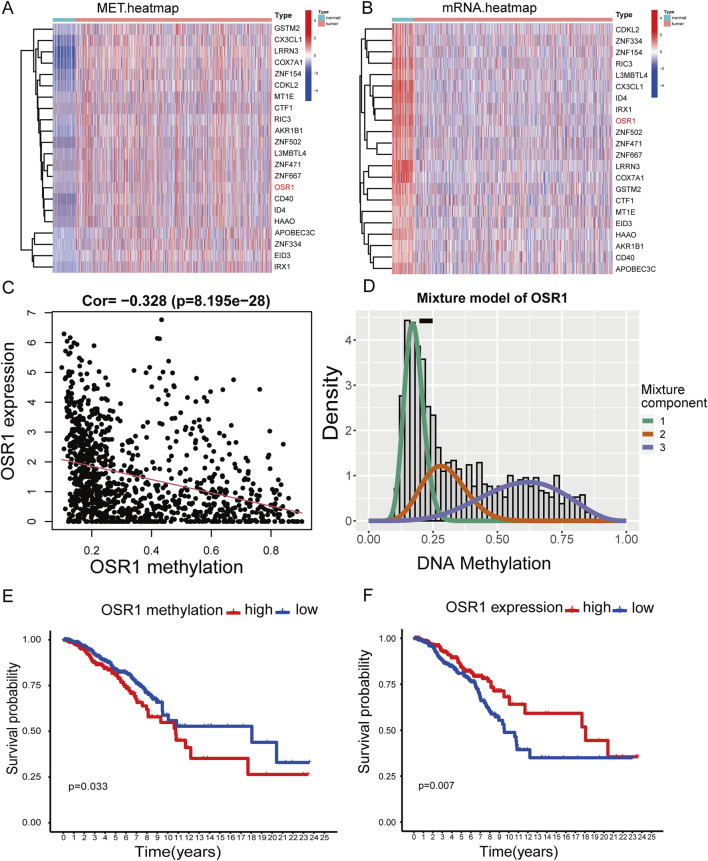
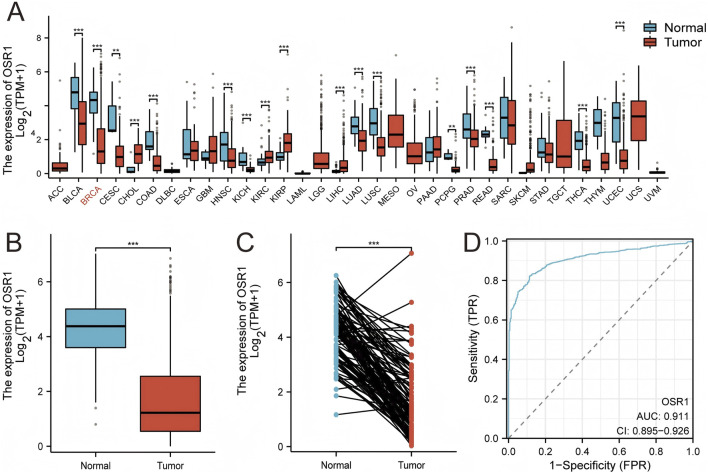
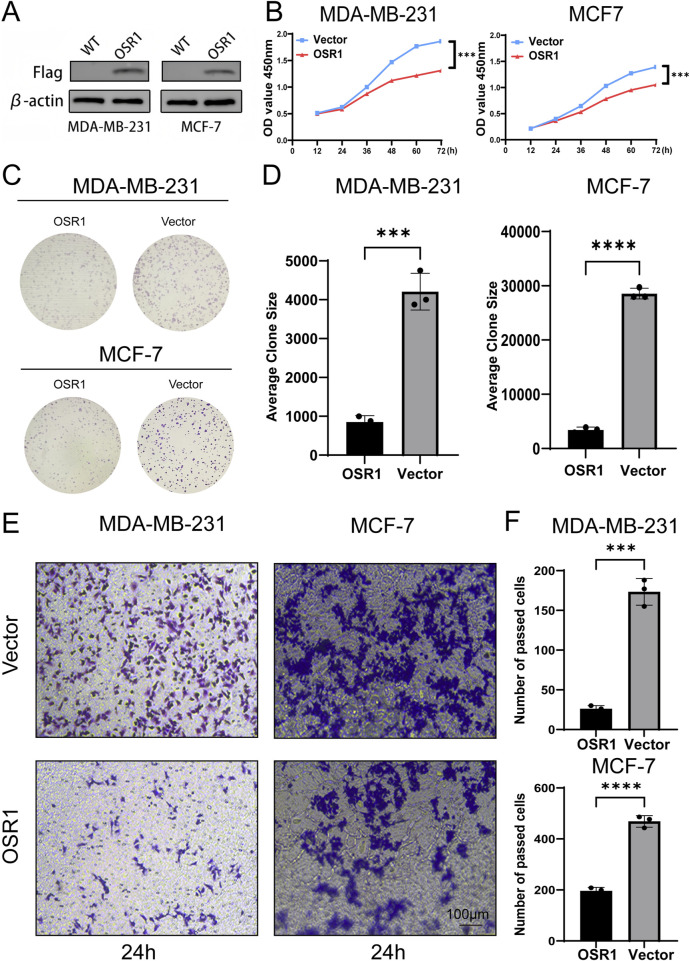
Methods: RNA sequencing and DNA methylation data for breast cancer were retrieved from The Cancer Genome Atlas (TCGA). Prognostically relevant methylation-driven genes were identified by integrating the methylation R package with univariate Cox regression analysis, and OSR1 emerged as the primary candidate. Gene expression profiles and corresponding clinical data were subsequently obtained from TCGA. Differential expression analysis using the Wilcoxon rank-sum test revealed significantly reduced OSR1 expression in breast cancer tissues compared to normal counterparts. Kaplan-Meier survival curves and Cox regression models were applied to assess the prognostic significance of OSR1. Bioinformatic analyses investigated associations between OSR1 expression and clinicopathological features, pathway enrichment, and immune cell infiltration. Experimental validation was conducted by generating OSR1-overexpressing breast cancer cell lines to examine effects on cell viability, migration, and proliferation via phenotypic assays.

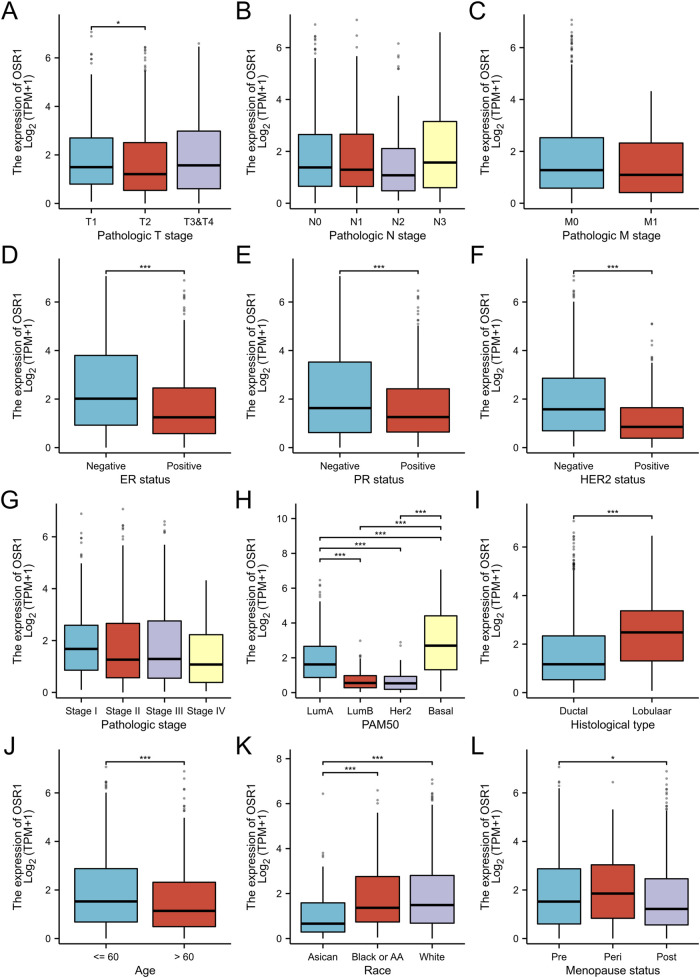
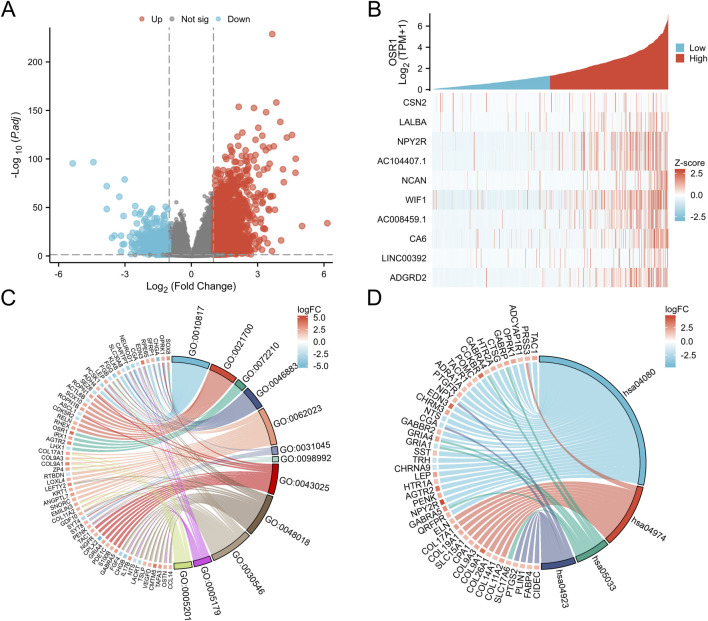
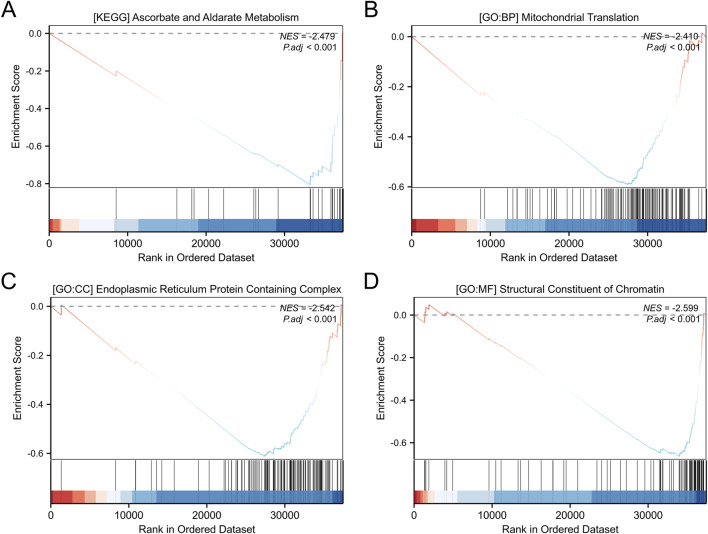
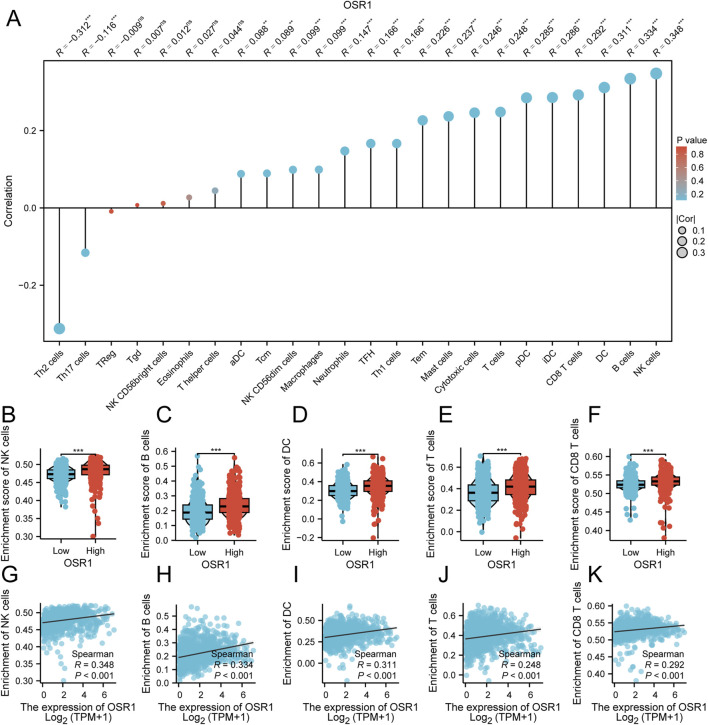
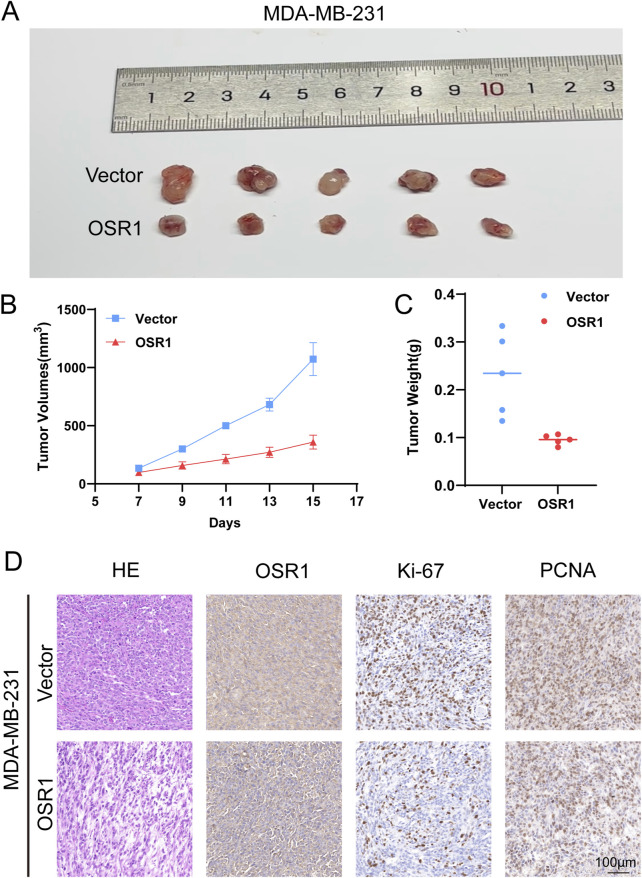
Results: OSR1 expression was significantly reduced in breast cancer tissues and correlated negatively with breast cancer progression. Low OSR1 expression was significantly associated with M stage, HER2 status, PAM50 subtypes, and histological classification, and linked to poorer overall survival outcomes. Functional enrichment implicated OSR1 in pathways related to peptide hormone secretion, peptide transport, metal ion response, and forebrain development. Elevated OSR1 expression was positively correlated with increased infiltration of NK cells, B cells, CD8+ T cells, and dendritic cells. Both in vitro and in vivo studies demonstrated that OSR1 overexpression markedly suppressed breast cancer cell proliferation and migration.

Discussion: These findings confirm OSR1 as a methylation-regulated tumor suppressor gene and underscore its potential as a promising biomarker for individualized therapeutic strategies in breast cancer.

Keywords: DNA methylation; OSR1; TCGA; breast cancer; methylation-driven genes.


Conflict of interest statement

The authors declare that the research was conducted in the absence of any commercial or financial relationships that could be construed as a potential conflict of interest.

Figures

FIGURE 1
FIGURE 1
Heatmaps of methylation-driven genes and corresponding survival analysis. (A) Clustered heatmap illustrating methylation levels of genes in breast cancer, with a gradient from blue to red representing low to high methylation intensity. (B) Clustered heatmap of gene expression profiles, with red to blue indicating a transition from high- to low-expression levels. (C,D) Correlation analysis between OSR1 methylation status and its transcript abundance. (E) Kaplan–Meier (K–M) survival analysis of overall survival (OS) of patients with breast cancer in TCGA stratified by OSR1 methylation levels. (F) K–M survival curve of OS based on OSR1 expression levels in the TCGA cohort.
FIGURE 2
FIGURE 2
OSR1 expression patterns across tumor types and in breast cancer. (A) Comparative analysis of OSR1 expression across various tumor types and corresponding normal tissues using the TCGA and GTEx datasets. (B) OSR1 expression in breast cancer versus non-matched normal tissues from TCGA and GTEx. (C) Differential expression of OSR1 between breast cancer and matched adjacent normal tissues within TCGA. (D) ROC curve assessing the discriminative power of OSR1 expression between tumor and normal breast tissue in TCGA. TCGA: The Cancer Genome Atlas; GTEx: Genotype-tissue expression project; ROC: Receiver operating characteristic. *p < 0.05, **p < 0.01, ***p < 0.001.
FIGURE 3
FIGURE 3
Association between OSR1 expression and clinicopathological parameters. (A–L) Stratification of OSR1 expression by T stage (A), N stage (B), M stage (C), ER status (D), PR status (E), HER2 status (F), pathological stage (G), PAM50 subtype (H), histological classification (I), patient age (J), race (K), and menopausal status (L). LumA: Luminal A; LumB: Luminal B; ER: Estrogen receptor; PR: Progesterone receptor; HER2: Human epidermal growth factor receptor 2.
FIGURE 4
FIGURE 4
Differentially expressed genes (DEGs) associated with OSR1 and functional enrichment in breast cancer. (A) Volcano plot of OSR1-related DEGs, where red and blue dots denote significantly upregulated and downregulated genes, respectively. (B) Heatmap displaying correlations between OSR1 expression and the top 10 DEGs. (C) GO enrichment analysis of DEGs. (D) KEGG pathway enrichment analysis of DEGs. GO: Gene Ontology; KEGG: Kyoto Encyclopedia of Genes and Genomes; DEGs: differentially expressed genes. *p < 0.05, **p < 0.01, ***p < 0.001.
FIGURE 5
FIGURE 5
GO and KEGG enrichment analyses of differentially expressed genes. (A) KEGG pathway enrichment analysis of genes stratified by high and low expression levels. (B–D) GO functional annotation of DEGs, including biological processes (B), cellular components (C), and molecular functions (D). GSEA: gene set enrichment analysis; NES: normalized enrichment score. A positive NES indicates that the gene set is enriched at the top of the ranked list (e.g., upregulated pathways), while a negative NES indicates enrichment at the bottom of the ranked list (e.g., downregulated pathways).
FIGURE 6
FIGURE 6
Association between OSR1 expression and immune cell infiltration in breast cancer. (A) Correlation matrix depicting associations between OSR1 expression and the relative abundance of 24 immune cell types. The dot size indicates the magnitude of the Spearman correlation coefficient. (B–F) Comparative analysis of immune infiltration levels between OSR1 high- and low-expression groups for NK cells, B cells, DC cells, T cells, and CD8+ T cells. (G–K) Correlation plots between OSR1 expression and enrichment scores for the same immune cell subsets. NK cells: Natural killer cells; DC cells: Dendritic cells.
FIGURE 7
FIGURE 7
Functional effects of OSR1 overexpression on proliferation and migration in breast cancer cell lines. (A) Western blot validation of OSR1 overexpression via Flag-tagged lentiviral vectors in MDA-MB-231 and MCF-7 cells. (B) Cell proliferation rates were quantified using the CCK-8 assay. (C,D) Colony formation assays were performed to evaluate the impact of OSR1 overexpression on clonogenic potential. (E,F) Transwell migration assays assessed the migratory capability of OSR1-overexpressing MDA-MB-231 and MCF-7 cells. Scale bar: 100 μm. Data are presented as mean ± SD from three independent experiments unless otherwise stated. ***p < 0.001.
FIGURE 8
FIGURE 8
OSR1-mediated tumor promotion in vivo. (A–D) In vivo tumorigenicity following subcutaneous implantation of MDA-MB-231 cells into nude mice. (A) Representative images of excised tumors. (B) Tumor volume measurements. (C) Final tumor weights. (D) Histological evaluation of tumor sections by H&E staining and IHC detection of OSR1, Ki-67, and PCNA. Scale bar: 100 μm.

Similar articles

References

    1. Alessi D. R., Zhang J., Khanna A., Hochdörfer T., Shang Y., Kahle K. T. (2014). The WNK-SPAK/OSR1 pathway: master regulator of cation-chloride cotransporters. Sci. Signal 7 (334), re3. 10.1126/scisignal.2005365 - DOI - PubMed
    1. Bray F., Laversanne M., Sung H., Ferlay J., Siegel R. L., Soerjomataram I., et al. (2024). Global cancer statistics 2022: GLOBOCAN estimates of incidence and mortality worldwide for 36 cancers in 185 countries. CA Cancer J. Clin. 74 (3), 229–263. 10.3322/caac.21834 - DOI - PubMed
    1. Chen W., Wu K., Zhang H., Fu X., Yao F., Yang A. (2018). Odd-skipped related transcription factor 1 (OSR1) suppresses tongue squamous cell carcinoma migration and invasion through inhibiting NF-κB pathway. Eur. J. Pharmacol. 839, 33–39. 10.1016/j.ejphar.2018.09.020 - DOI - PubMed
    1. Chen W., Yazicioglu M., Cobb M. H. (2004). Characterization of OSR1, a member of the mammalian Ste20p/germinal center kinase subfamily. J. Biol. Chem. 279 (12), 11129–11136. 10.1074/jbc.M313562200 - DOI - PubMed
    1. Dbouk H. A., Weil L. M., Perera G. K., Dellinger M. T., Pearson G., Brekken R. A., et al. (2014). Actions of the protein kinase WNK1 on endothelial cells are differentially mediated by its substrate kinases OSR1 and SPAK. Proc. Natl. Acad. Sci. U. S. A. 111 (45), 15999–16004. 10.1073/pnas.1419057111 - DOI - PMC - PubMed

LinkOut - more resources