. 2025 Jul 21;19(3):e70034.
doi: 10.1002/ccs3.70034. eCollection 2025 Sep.

UBD-mediated glycolytic reprogramming promotes M2 macrophage polarization in ovarian cancer immune evasion

Affiliations

UBD-mediated glycolytic reprogramming promotes M2 macrophage polarization in ovarian cancer immune evasion

Nana Zhang et al. J Cell Commun Signal. .

Abstract

Ovarian cancer (OC) is one of the most common malignant tumors in women, with immunotherapy resistance (ITR) being a major challenge. Glycolytic metabolic reprogramming has been shown to play a crucial role in the tumor immune microenvironment and immune evasion, yet the underlying mechanisms remain unclear. This study aims to investigate the role of Ubiquitin D (UBD) in OC immunotherapy, particularly its regulation of macrophage polarization through glycolytic metabolism. Using data from the Cancer Genome Atlas and Clinical Proteomic Tumor Analysis Consortium databases, combined with proteomics techniques, we analyzed the expression of UBD in OC tissues and its correlation with key glycolytic enzymes. Through lentiviral-mediated gene manipulation and in vivo mouse models, we evaluated the effects of UBD on macrophage polarization, glycolytic metabolism, and immunotherapy. The results indicate that UBD promotes M2 macrophage polarization through glycolytic reprogramming, enhancing immune evasion and ITR in OC. Inhibiting UBD or targeting glycolytic pathways may provide new strategies for improving OC immunotherapy.

Keywords: glycolytic metabolism; immunotherapy resistance; macrophage polarization; ovarian cancer; tumor microenvironment; ubiquitin D.


Conflict of interest statement

The authors declare no conflicts of interest.

Figures

FIGURE 1
FIGURE 1
Transcriptomic Analysis Reveals the Expression of UBD in OC and Its Association with Glycolytic Metabolism‐Related Genes. (A) Expression levels of UBD in OC and normal ovarian tissues; (B) Co‐expression analysis of UBD with key glycolytic genes; (C) Kaplan‐Meier survival curve analysis comparing survival rates between high and low UBD expression groups in OC patients; (D) CIBERSORT analysis revealing the correlation between high UBD expression and M2 macrophage infiltration in OC tissues; (E–G) Co‐expression analysis of UBD with M2 macrophage markers (CD163, CCL18, and TGFB1). OC, ovarian cancer; UBD, Ubiquitin D.
FIGURE 2
FIGURE 2
Correlation of UBD and Glycolysis‐related Proteins in ovarian cancer Based on Proteomics Analysis. (A) Expression differences of key glycolysis proteins between high and low UBD expression groups; (B) Proteomics network analysis showing the activation of glycolysis in high UBD expression samples; (C) Correlation analysis between UBD expression levels and glycolysis‐related proteins; (D) Co‐expression analysis of UBD with glycolysis‐related proteins. UBD, Ubiquitin D.
FIGURE 3
FIGURE 3
In Vitro Cell Experiments Validating the Effect of UBD on Macrophage Polarization and Glycolytic Metabolism. (A) Experimental workflow for UBD gene knockdown in macrophages mediated by lentivirus; (B) reverse transcription quantitative polymerase chain reaction analysis of mRNA expression levels of M2 macrophage marker ARG1 and M1 macrophage marker iNOS in macrophages; (C) Western blot analysis of protein expression levels of ARG1 and iNOS in macrophages; (D, E) Immunofluorescence staining of ARG1 and iNOS in macrophages to observe changes in fluorescence signals; (F, G) RT‐qPCR and Western blot analysis of mRNA and protein expression levels of glycolysis‐related genes HK2 and PFKFB3 following UBD knockdown; (H–I) Measurement of lactate production and ATP levels in macrophages to assess glycolytic activity after UBD knockdown; (J) Detection of mRNA levels of lactate dehydrogenase LDHA after UBD knockdown using RT‐qPCR; (K) Glucose uptake assay to assess the impact of UBD knockdown on glucose uptake in macrophages. All data are presented as mean ± standard error, with all cell experiments repeated three times. iNOS, inducible nitric oxide synth; UBD, Ubiquitin D. *Indicates statistical significance between groups, ***p < 0.001, ****p < 0.0001.
FIGURE 4
FIGURE 4
Effects of UBD Knockdown or Overexpression in Macrophages on OC Cell Proliferation, Migration, Invasion, and Immune Therapy Sensitivity. (A) Schematic illustrating the experimental procedure for evaluating the impact of UBD on macrophage regulation of OC cells; (B, C) CCK‐8 assay to assess the effect of UBD overexpression/knockdown in macrophages on OC cell proliferation; (D) Colony formation and Transwell assays to examine the effects of UBD overexpression/knockdown in macrophages on OC cell proliferation, migration, and invasion; (E) Quantitative analysis of colony formation assays; (F) Quantification of migrated OC cells co‐cultured with different groups of macrophages; (G) Quantification of invaded OC cells co‐cultured with different groups of macrophages; (H) Effect of PD‐L1 Antibody on OC cell survival in the context of UBD‐regulated macrophage activity. Data are presented as mean ± standard error, with experiments conducted in triplicate. OC, ovarian cancer; UBD, Ubiquitin D. *Indicates significance compared between groups, *p < 0.05, **p < 0.01, ***p < 0.001, ****p < 0.0001.
FIGURE 5
FIGURE 5
Effects of Glycolysis Inhibitor 2‐DG and Glycolysis Activator PFKFB3 on UBD‐regulated Macrophage Polarization and Sensitivity to OC Immunotherapy. (A) Experimental schematic illustrating the effect of UBD on macrophage polarization and immune response through glycolytic metabolism; (B, C) Changes in mRNA and protein levels of iNOS and ARG1 in UBD‐overexpressing macrophages after 2‐DG treatment; (D, E) Changes in mRNA and protein levels of ARG1 and iNOS in UBD‐knockdown macrophages after PFKFB3 activator treatment; (F) Effect of PD‐L1 antibody on OC cell survival in the co‐culture system of UBD‐overexpressing macrophages treated with 2‐DG; (G) Effect of PD‐L1 antibody on OC cell survival in the co‐culture system of UBD‐knockdown macrophages treated with PFKFB3 activator. All data are presented as mean ± standard error. Cell experiments were repeated three times. iNOS, inducible nitric oxide synth; OC, ovarian cancer; UBD, Ubiquitin D. * denotes comparison between groups, ***p < 0.001.
FIGURE 6
FIGURE 6
Ubiquitin D Regulates Tumor Growth and Metastasis in an ovarian cancer Mouse Model through Glycolytic Metabolic Reprogramming. (A) Schematic diagram illustrating the experimental process for assessing the effect of UBD and PD‐L1 on tumor growth in mice; (B) Kaplan‐Meier survival analysis comparing the survival time of mice in the sh‐NC and sh‐UBD groups; (C) Kaplan‐Meier survival analysis comparing the survival time of mice in the oe‐NC and oe‐UBD groups; (D) Tumor growth analysis in different experimental groups via tissue dissection; (E) Quantification of tumor volume from dissected tumors. All data are presented as mean ± standard error, with 10 mice per group in animal experiments. *Denotes comparison between groups, **p < 0.01, ****p < 0.0001.
FIGURE 7
FIGURE 7
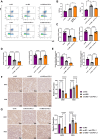
Ubiquitin D Regulates Macrophage Polarization and Tumor Immune Microenvironment via Glycolytic Metabolism. (A, B) Flow cytometric analysis of CD8+ T cell infiltration in tumor tissues from different treatment groups; (C, D) Colorimetric assays measuring lactate and ATP levels in tumor tissues from mice in different groups; (E) Reverse transcription quantitative polymerase chain reaction detection of mRNA level of lactate dehydrogenase LDHA in tumor tissues of different groups of mice; (F, G) Immunohistochemical detection of M2 macrophage marker ARG and M1 macrophage marker inducible nitric oxide synthase expression in tumor tissues from each group. All data are presented as mean ± standard error, with experiments repeated three times and 10 mice per group. *Indicates comparison between two groups, **p < 0.01, ***p < 0.001, ****p < 0.0001.

Similar articles

References

    1. Mazidimoradi, Afrooz , Momenimovahed Zohre, Allahqoli Leila, Tiznobaik Azita, Hajinasab Negar, Salehiniya Hamid, and Alkatout Ibrahim. 2022. “The Global, Regional and National Epidemiology, Incidence, Mortality, and Burden of Ovarian Cancer.” Health Science Reports 5(6). 10.1002/hsr2.936. - DOI - PMC - PubMed
    1. Colombo, Nicoletta , Lorusso Domenica, and Scollo Paolo. 2017. “Impact of Recurrence of Ovarian Cancer on Quality of Life and Outlook for the Future.” International Journal of Gynecological Cancer 27(6): 1134–1140. 10.1097/igc.0000000000001023. - DOI - PMC - PubMed
    1. Hogen, Liat , Vicus Danielle, Ferguson Sarah Elizabeth, Gien Lilian T., Nofech‐Mozes Sharon, Lennox Genevieve K., and Bernardini Marcus Q.. 2019. “Patterns of Recurrence and Impact on Survival in Patients with Clear Cell Ovarian Carcinoma.” International Journal of Gynecological Cancer 29(7): 1164–1169. 10.1136/ijgc-2019-000287. - DOI - PubMed
    1. Wang, Hongbin , Wang Xueying, Zhang Xin, and Xu Wanhai. 2024. “The Promising Role of Tumor‐Associated Macrophages in the Treatment of Cancer.” Drug Resistance Updates 73: 101041. 10.1016/j.drup.2023.101041. - DOI - PubMed
    1. Pan, Yueyun , Yu Yinda, Wang Xiaojian, and Zhang Ting. 2020. “Tumor‐Associated Macrophages in Tumor Immunity.” Frontiers in Immunology 11. 10.3389/fimmu.2020.583084. - DOI - PMC - PubMed

LinkOut - more resources