

LYN and CYBB are pivotal immune and inflammatory genes as diagnostic biomarkers in recurrent spontaneous abortion
- PMID: 40692778
- PMCID: PMC12278907
- DOI: 10.3389/fimmu.2025.1568536
LYN and CYBB are pivotal immune and inflammatory genes as diagnostic biomarkers in recurrent spontaneous abortion
Abstract
Recurrent spontaneous abortion (RSA) seriously affects women's reproductive health, and its pathogenesis is complex and varied. The aim of this study is to identify key molecular markers closely associated with RSA to rapidly and effectively predict the RSA, and to provide simple and practical indicators for clinical diagnosis and treatment.
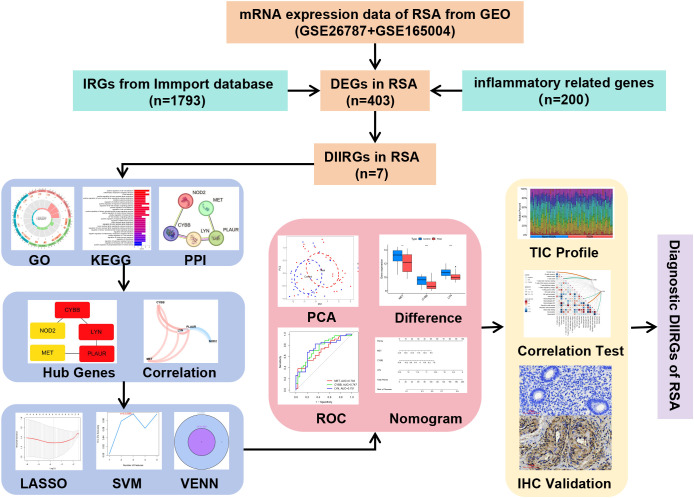
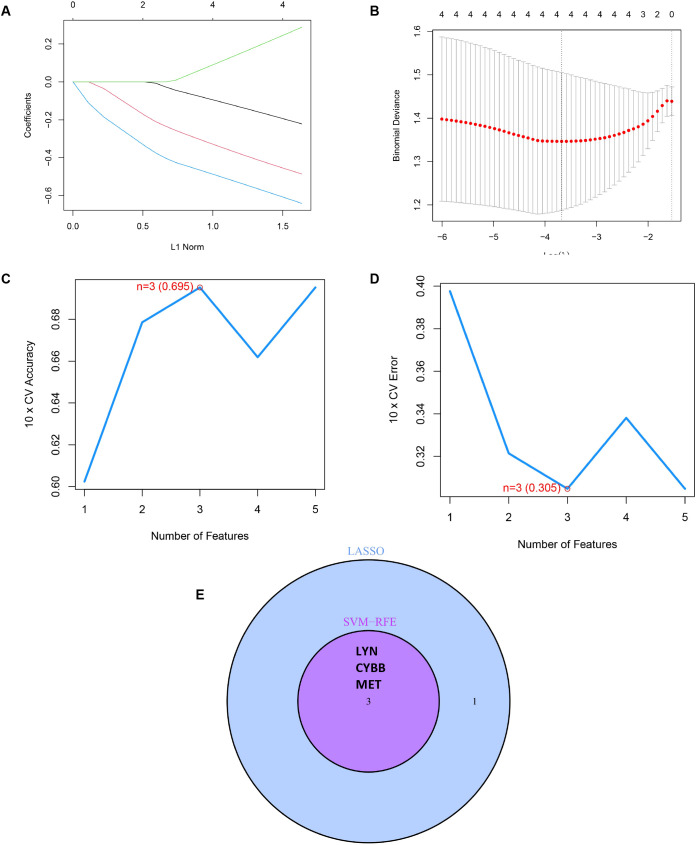
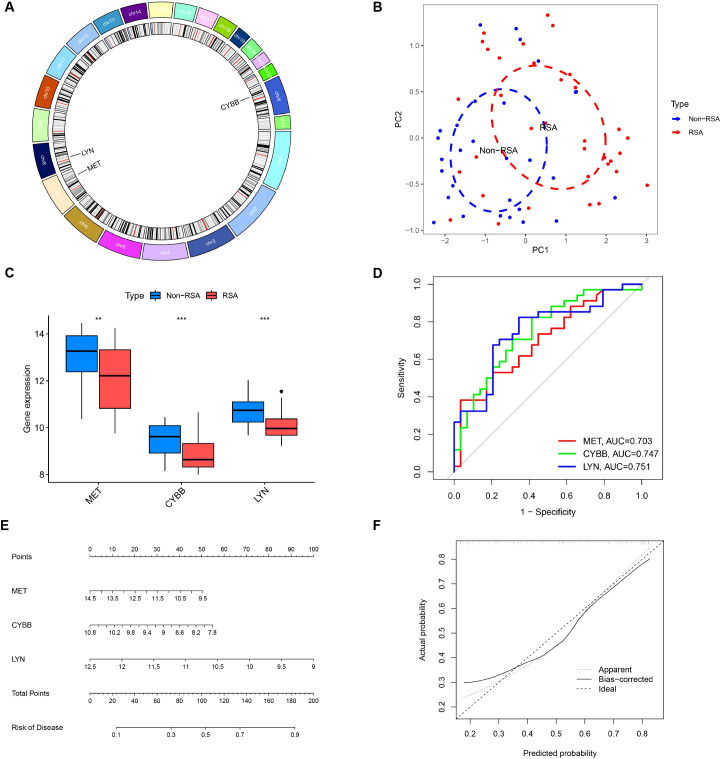
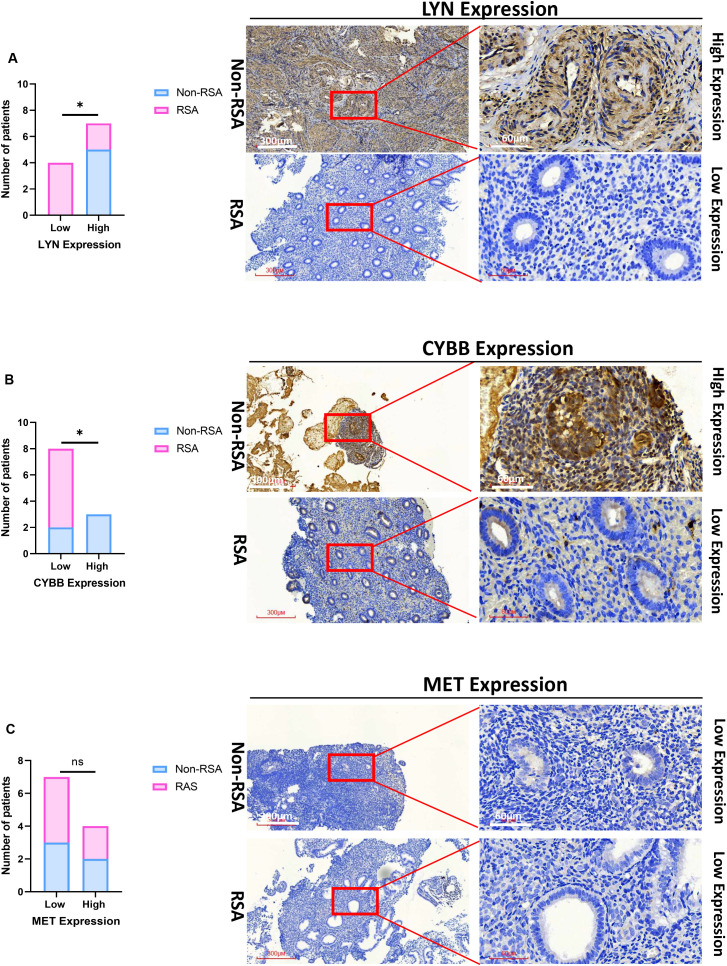
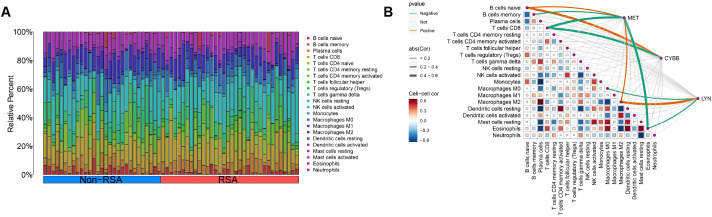
Method: We obtained mRNA expression profiles from the GSE26787 and GSE165004 datasets of the Gene Expression Omnibus (GEO) database, immune-related genes (IRGs) from the ImmPort database (https://www.immport.org), and genes related to inflammatory response from the Molecular Signatures database. Different Inflammation- and immunity-related genes (DIIRGs) were subjected to Gene Ontology (GO) and Kyoto Encyclopedia of Genes and Genomes (KEGG) analysis. Protein-protein interaction (PPI) networks were utilized to explore the connections between various DIIRGs. The candidate DIIRGs were analyzed by the least absolute shrinkage and selection operator (LASSO) and the multiple support vector machine recursive feature elimination (mSVM-RFE). The diagnostic ability of the candidate genes was verified using receiver operating characteristic (ROC) curves. The performance of the predictive model was evaluated using a Nomo plot. We further confirmed the expression levels and diagnostic value of key genes by performing immunohistochemistry (IHC) in clinical tissue samples. The compositional patterns of the infiltration of 22 immune cell types in RSA were analyzed via the CIBERSORT algorithm.
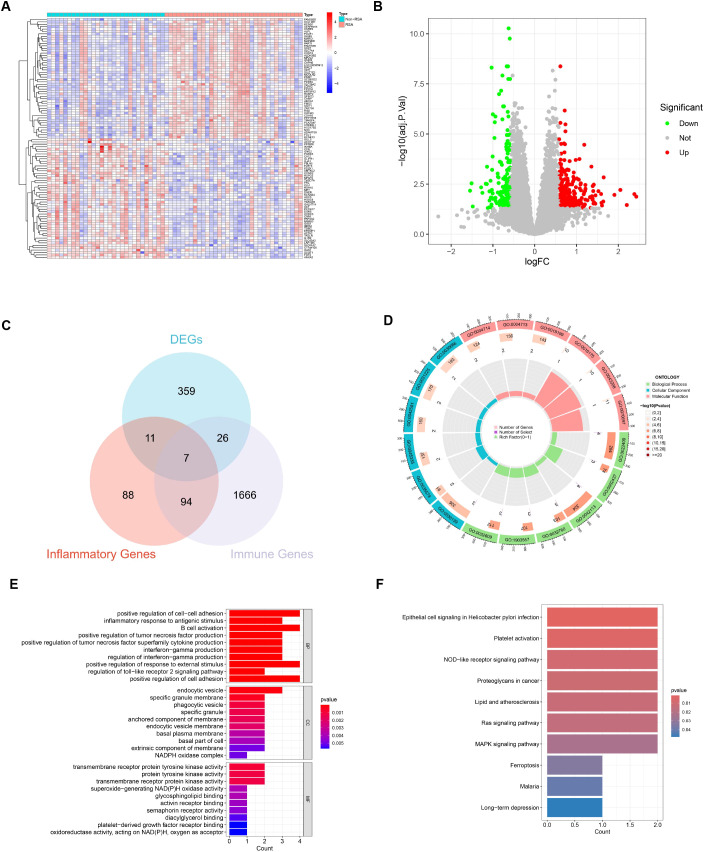
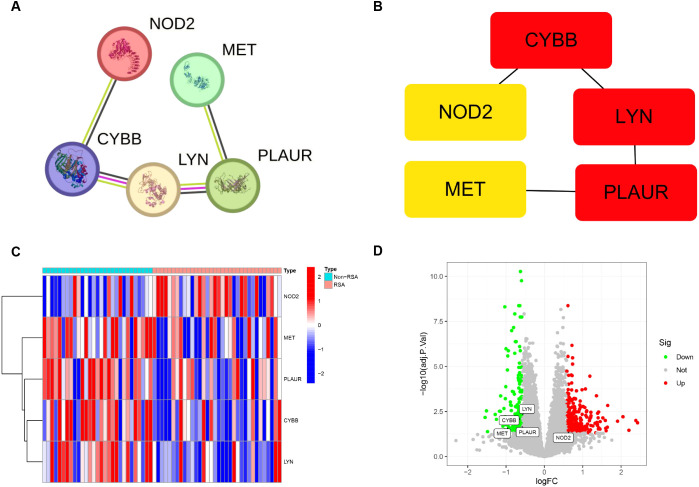
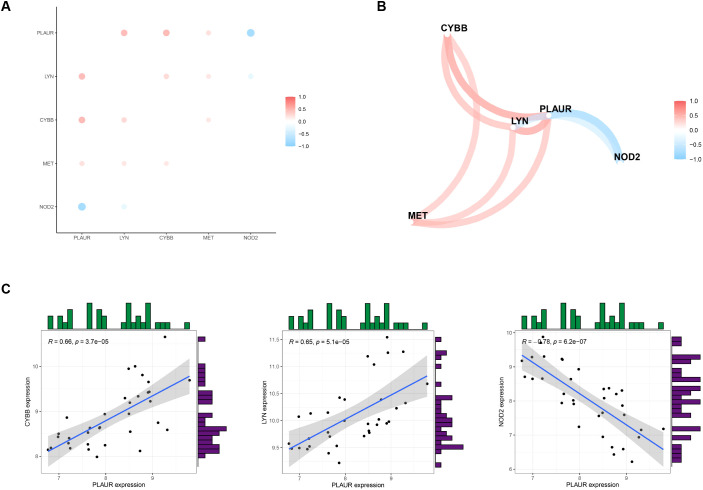
Result: We identified 403 differentially expressed genes (DEGs) and 7 DIIRGs between RSA endometrium and Non-RSA endometrium. GO analysis showed that DIIRGs were significantly enriched in positive regulation of cell-cell adhesion, inflammatory response to antigenic stimulus, and protein tyrosine kinase activity. KEGG enrichment analyses were performed mainly on Epithelial cell signaling in Helicobacter pylori infection, NOD-like receptor signaling pathway, and Ras signaling pathway. A predictive and diagnostic model composed of three genes (CYBB, LYN, and MET). The CYBB, LYN, and MET genes were identified as diagnostic biomarkers of RSA (AUC = 0.747, AUC = 0.751, AUC=0.703), and reduced levels of CYBB and LYN expression were found to correlate with RSA in clinical samples. In addition, immune microenvironment analysis showed that CYBB and MET were positively correlated with naïve B cells and negatively correlated with CD8 T cells, LYN and MET were positively correlated with M2 macrophages and negatively correlated with eosinophils, respectively (P < 0.05).
Conclusion: Inflammation-immunity is a key factor in the pathogenesis of RSA. CYBB and LYN are regarded as the crucial genes that constitute a model and contribute to inflammation-immunity throughout the occurrence and progression of RSA. These findings provide a new perspective on the diagnosis and pathogenesis of RSA.
Keywords: cybb; immunity; inflammation; lyn; recurrent spontaneous abortion.
Copyright © 2025 Wu, Lin, Zhou, Xie, Huang, Sheng, Shi and Ke.
Conflict of interest statement
The authors declare that the research was conducted in the absence of any commercial or financial relationships that could be construed as a potential conflict of interest.
Figures
Similar articles
-
Machine learning based screening of biomarkers associated with cell death and immunosuppression of multiple life stages sepsis populations.Sci Rep. 2025 Aug 19;15(1):30302. doi: 10.1038/s41598-025-14600-0. Sci Rep. 2025. PMID: 40830558 Free PMC article.
-
Deciphering Shared Gene Signatures and Immune Infiltration Characteristics Between Gestational Diabetes Mellitus and Preeclampsia by Integrated Bioinformatics Analysis and Machine Learning.Reprod Sci. 2025 Jun;32(6):1886-1904. doi: 10.1007/s43032-025-01847-1. Epub 2025 May 15. Reprod Sci. 2025. PMID: 40374866
-
Identification of osteoporosis ferroptosis-related markers and potential therapeutic compounds based on bioinformatics methods and molecular docking technology.BMC Med Genomics. 2024 Apr 22;17(1):99. doi: 10.1186/s12920-024-01872-0. BMC Med Genomics. 2024. PMID: 38650009 Free PMC article.
-
Blood biomarkers for the non-invasive diagnosis of endometriosis.Cochrane Database Syst Rev. 2016 May 1;2016(5):CD012179. doi: 10.1002/14651858.CD012179. Cochrane Database Syst Rev. 2016. PMID: 27132058 Free PMC article.
-
Systemic pharmacological treatments for chronic plaque psoriasis: a network meta-analysis.Cochrane Database Syst Rev. 2021 Apr 19;4(4):CD011535. doi: 10.1002/14651858.CD011535.pub4. Cochrane Database Syst Rev. 2021. Update in: Cochrane Database Syst Rev. 2022 May 23;5:CD011535. doi: 10.1002/14651858.CD011535.pub5. PMID: 33871055 Free PMC article. Updated.
References
MeSH terms
Substances
LinkOut - more resources
Full Text Sources
Research Materials
Miscellaneous