. 2025 Jul;30(7):075002.
doi: 10.1117/1.JBO.30.7.075002. Epub 2025 Jul 21.

Evaluation of layered tissue scattering properties: a time-domain spatially resolved spectroscopy approach

Affiliations

Evaluation of layered tissue scattering properties: a time-domain spatially resolved spectroscopy approach

Elisabetta Avanzi et al. J Biomed Opt. 2025 Jul.

Abstract

Significance: The spatially resolved spectroscopy (SRS) approach is widely used in continuous wave near-infrared spectroscopy to estimate tissue oxygen saturation in the skeletal muscle and cerebral cortex. The extension of the SRS approach to the time domain (TD) has never been proposed. We hypothesize that the time-domain spatially resolved spectroscopy (TD SRS) approach, relying on simple models and linear fit, avoiding nonlinear model-based analysis approaches, could be able to assess the homogeneity of the scattering of the explored tissue.

Aim: We aim to explore the potential of the TD SRS approach for estimating μ s ' from the spatial derivative of the measured signal in a homogeneous and in a two-layer medium and by considering also the effect of the instrument response function (IRF).

Approach: A theoretical expression for μ s ' depending on the spatial derivative of the attenuation is derived. Then, numerical simulations are conducted using solutions of the radiative transfer equation under the diffusion approximation. We consider a reflectance geometry with source-detector distance in the range 1 to 5 cm in 0.5 cm step, either in a homogenous semi-infinite or two-layer diffusive medium. Convolution with a real IRF is also carried out to mimic experimental scenarios.

Results: In a homogeneous medium, the TD SRS approach is able to retrieve μ s ' over a large range of values, being minimally affected by the IRF. In a two-layer medium, the TD SRS approach can only provide information on the changes of μ s ' with depth but fails to provide a robust estimate of the absolute value of μ s ' in either of the two layers. Moreover, the IRF can greatly affect the results in the case of the two-layer medium.

Conclusions: The TD SRS approach can be a simple way to estimate spatial changes of μ s ' but not the absolute value of μ s ' . Care should be taken to use a TD system with proper IRF.

Keywords: reduced scattering coefficient; spatially resolved spectroscopy; time domain; two-layer diffusive medium.


Figures

Fig. 1
Fig. 1
(a) Geometry used for the simulation of the two-layer structure. (b) The IRFs used for the simulation of real system data (SNSPD, superconducting nanowire single photon detector; HYPM, hybrid photomultiplier; SiPM, silicon photomultiplier).
Fig. 2
Fig. 2
Plots of the retrieved μs as a function of time for all the ρL at all the nominal reduced scattering coefficients (colors) in a homogeneous medium with Dirac δ IRF. The μa is set to 0.15  cm1. The shaded areas extend from 90% to 10% of the peak of the TD reflectance curve and represent the time intervals used for the calculation of the average.
Fig. 3
Fig. 3
Average retrieved μs versus nominal values for each absorption coefficient, represented by different colors and markers across various ρL. Thin solid lines indicate the expected values in each plot. The results are obtained in a homogeneous medium with a Dirac δ IRF.
Fig. 4
Fig. 4
Figure-of-merit values illustrating the average μs retrieved versus nominal values for each absorption coefficient, represented by different colors and markers across various ρL. Thin solid lines indicate the expected values in each plot. The results obtained in a homogeneous medium with SNSPD IRF.
Fig. 5
Fig. 5
Figure-of-merit values illustrating the average μs retrieved versus nominal values for each absorption coefficient, represented by different colors and markers across various ρL. Thin solid lines indicate the expected values in each plot. The results obtained in a homogeneous medium with HYPM IRF.
Fig. 6
Fig. 6
Figure-of-merit values illustrating the average μs retrieved versus nominal values for each absorption coefficient, represented by different colors and markers across various ρL. Thin solid lines indicate the expected values in each plot. The results obtained in a homogeneous medium with SiPM IRF.
Fig. 7
Fig. 7
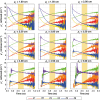
Plots of the retrieved μs as a function of time for all the ρL at all six combinations of two-layer media (colors), for thickness s1=0.5  cm. In yellow, it is highlighted the time interval used for the calculation of the slope. The results obtained with Dirac δ IRF.
Fig. 8
Fig. 8
Slope of retrieved μs as a function of time for all the ρL and thicknesses. The results obtained with Dirac δ IRF. For positive (negative) slope values, the cells are colored in blue (red). The intensity of the color depends on the magnitude.
Fig. 9
Fig. 9
Plots of the retrieved μs as a function of time for all the ρL at all six combinations of two-layer media (colors), for thickness s1=0.5  cm. In yellow, it is highlighted the time interval used for the calculation of the slope. The results associated with SNSPD IRF.
Fig. 10
Fig. 10
Plots of the retrieved μs as a function of time for all the ρL at all the six combinations of two-layer media (colors), for thickness s1=0.5  cm. In yellow, it is highlighted the time interval used for the calculation of the slope. The results associated with HYPM IRF.
Fig. 11
Fig. 11
Plots of the retrieved μs as a function of time for all the ρL at all the six combinations of two-layer media (colors), for thickness s1=0.5  cm. In yellow, it is highlighted the time interval used for the calculation of the slope. The results associated with SiPM IRF.
Fig. 12
Fig. 12
Slope of retrieved μs as a function of time for all the ρL and thicknesses. The results associated with SNSPD IRF. Color code same as in Fig. 11.
Fig. 13
Fig. 13
Slope of retrieved μs as a function of time for all the ρL and thicknesses. The results associated with HYPM IRF. Color code same as in Fig. 11.
Fig. 14
Fig. 14
Slope of retrieved μs as a function of time for all the ρL and thicknesses. The results associated with SiPM IRF. Color code same as in Fig. 11.

References

    1. Farrell T. J., Patterson M. S., Wilson B., “A diffusion theory model of spatially resolved, steady-state diffuse reflectance for the noninvasive determination of tissue optical properties in vivo,” Med. Phys. 19(4), 879–888 (1992). 10.1118/1.596777 - DOI - PubMed
    1. Suzuki S., et al. , “Tissue oxygenation monitor using NIR spatially resolved spectroscopy,” Proc. SPIE 3597, 582–592 (1999). 10.1117/12.356862 - DOI
    1. Cowdrick K., “NIRS & DCS commercially available product landscape,” 2023, https://datastudio.google.com/reporting/5f333396-7078-4f31-9056-e0f926b9....
    1. Amendola C., et al. , “Robustness of tissue oxygenation estimates by continuous wave space-resolved near infrared spectroscopy,” J. Biomed. Opt. 28(7), 075002 (2023). 10.1117/1.JBO.28.7.075002 - DOI - PMC - PubMed
    1. Patterson M. S., Chance B., Wilson B. C., “Time resolved reflectance and transmittance for the non-invasive measurement of tissue optical properties,” Appl. Opt. 28(12), 2331–2336 (1989). 10.1364/AO.28.002331 - DOI - PubMed

Publication types