

Biological characteristics of SARS-CoV-2 resistant populations by integrated gut microbiota sequencing, metabolomics, and proteomics: a cohort comparison study
- PMID: 40692947
- PMCID: PMC12277166
- DOI: 10.3389/fmed.2025.1593007
Biological characteristics of SARS-CoV-2 resistant populations by integrated gut microbiota sequencing, metabolomics, and proteomics: a cohort comparison study
Abstract
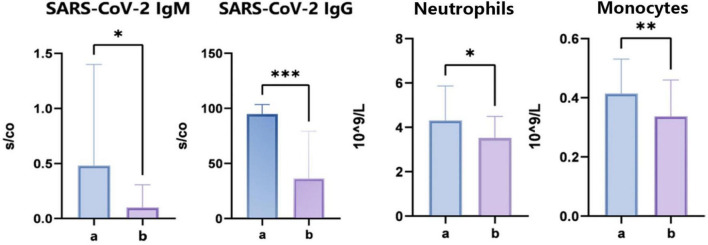
Objective: Most research reports on COVID-19 infections have focused on the correlation between the severity of the disease symptoms and immune deficits, while the mechanisms affecting the susceptibility to SARS-CoV-2 remain largely unknown. The study aimed to comprehensively analyze the differences in immunity, gut microbiota, metabolism, and proteomics between the SARS-CoV-2 resistant population and the susceptible population.
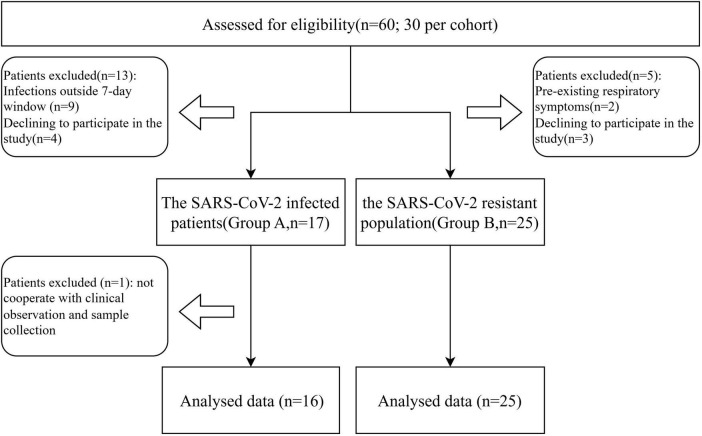
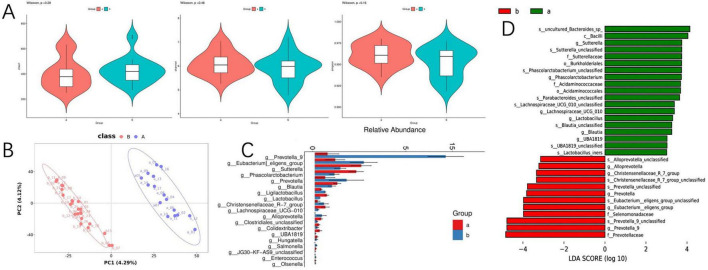
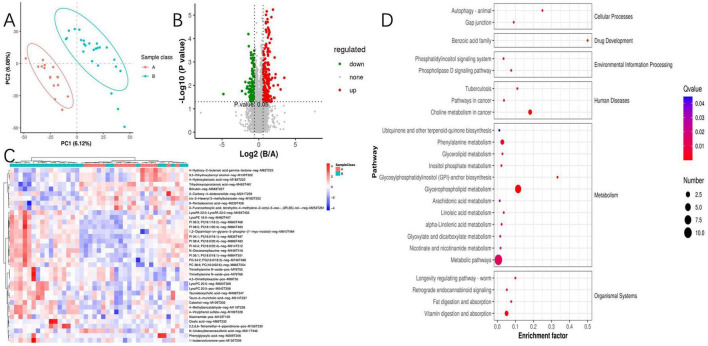
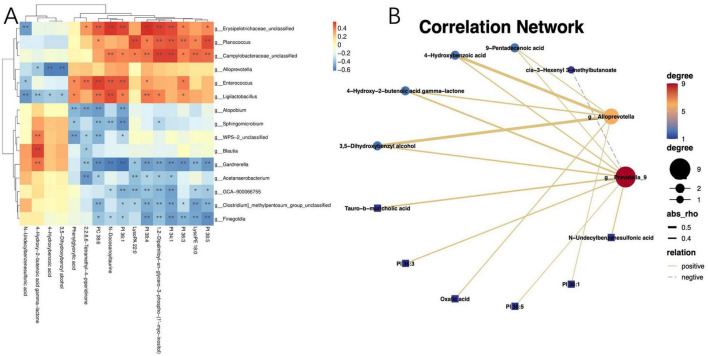
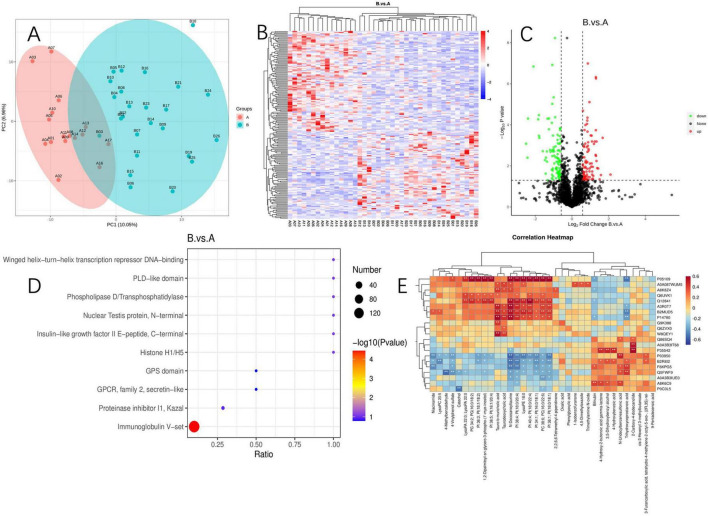
Methods and results: In this cohort comparison study, participants were rigorously selected based on inclusion and exclusion criteria in a continuous enrollment manner using combined questionnaires and clinical data, ultimately including 25 SARS-CoV-2 resistant volunteers versus 16 SARS-CoV-2 infected patients. The clinical information of the participants was recorded in detail, and fecal and blood samples were collected in a standardized manner for subsequent multi-omics analysis, including gut microbiota sequencing, metabolomics, and proteomics. This study has preliminarily elucidated the characteristics of the gut microbiota, serum metabolites, and serum proteins in the SARS-CoV-2 resistant population. It exhibits a unique metabolic signature characterized by elevated levels of serum phosphatidylinositol and the abundance of Prevotella, which may serve as a potential predictive biomarker for resistance to SARS-CoV-2.
Conclusion: Given the crucial role of phosphatidylinositol in cell membrane architecture and viral infectivity, this study provides a promising entry point for further research into the pathogenesis and prevention strategies of COVID-19.
Keywords: COVID-19; SARS-CoV-2; gut microbiota; metabolomics; multiomics; phosphatidylinositols; proteomics; resistant population.
Copyright © 2025 Xu, Li, Xu, Chen, Deng, Chen and Xu.
Conflict of interest statement
The authors declare that the research was conducted in the absence of any commercial or financial relationships that could be construed as a potential conflict of interest.
Figures
References
-
- Ibn-Mohammed T, Mustapha K, Godsell J, Adamu Z, Babatunde K, Akintade D, et al. A critical analysis of the impacts of COVID-19 on the global economy and ecosystems and opportunities for circular economy strategies. Resour Conserv Recycl. (2021) 164:105169. 10.1016/j.resconrec.2020.105169 - DOI - PMC - PubMed
LinkOut - more resources
Full Text Sources
Miscellaneous