. 2025 Jul 7:12:1615950.
doi: 10.3389/fmed.2025.1615950. eCollection 2025.

SHAP combined with machine learning to predict mortality risk in maintenance hemodialysis patients: a retrospective study

Affiliations

SHAP combined with machine learning to predict mortality risk in maintenance hemodialysis patients: a retrospective study

Peng Shu et al. Front Med (Lausanne). .

Abstract

Background: Patients undergoing maintenance hemodialysis face a high mortality rate, yet effective tools for predicting mortality risk in this population are lacking. This study aims to develop an interpretable machine learning model to predict mortality risk among maintenance hemodialysis patients.

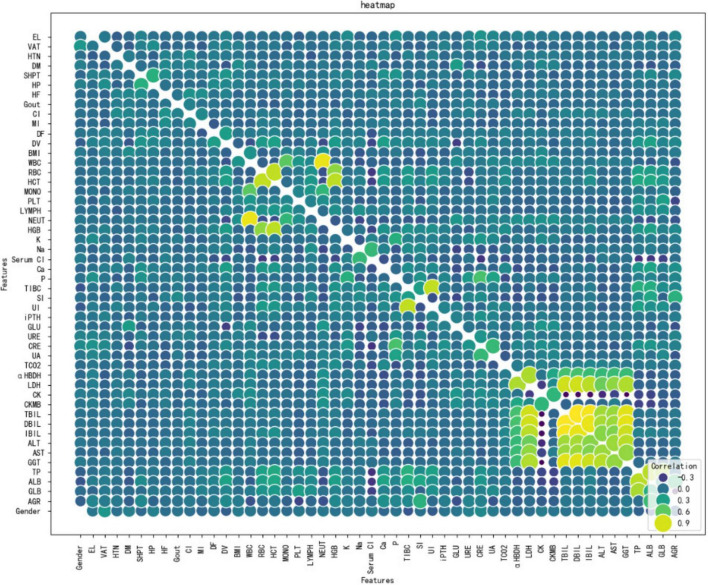
Methods: A retrospective analysis was conducted on clinical data from 512 maintenance hemodialysis patients treated at The Central Hospital of Wuhan between January 2021 and October 2024. The dataset included 50 feature variables. The data were split into a training set (70%) and a test set (30%). Five machine learning models-Random Forest, Extreme Gradient Boosting, Support Vector Machine, Logistic Regression, and K-Nearest Neighbor-were trained and evaluated for predicting patient mortality risk, using metrics such as the F1 score, precision, accuracy, AUC-ROC, and recall. SHAP values were used to assess the contribution of each feature in the best-performing model.

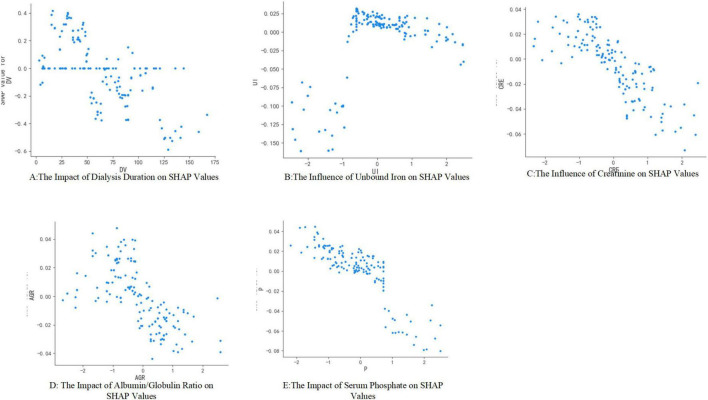
Results: The K-Nearest Neighbor model achieved the highest AUC-ROC of 0.9792 (95% CI: 0.9600-0.9929). SHAP analysis identified key factors influencing predictions, including dialysis duration, creatinine levels, white blood cell ratio, blood phosphorus concentration, and unconjugated iron.

Conclusion: The K-Nearest Neighbor model demonstrated high efficacy in predicting mortality risk among hemodialysis patients. SHAP analysis highlighted critical risk factors. While these findings show promise for future clinical research, they should be interpreted with caution due to the study's retrospective design and the need for external validation.

Keywords: SHAP; hemodialysis; machine learning; mortality risk; predictive modeling.


Conflict of interest statement

The authors declare that the research was conducted in the absence of any commercial or financial relationships that could be construed as a potential conflict of interest.

Figures

Flowchart depicting patient selection from a study at The Central Hospital of Wuhan. It started with 614 patients, excluding 102 for reasons like temporary catheters and missing data, resulting in 512 included patients. These were divided into a death group (212) and a survival group (300). Machine learning methods (LR, RF, SVM, XGBoost, KNN) were applied, with feature importance visualized using SHAP values.
FIGURE 1
Flowchart of study design.
ROC curve graph comparing five models: Logistic Regression (AUC 0.72), Random Forest (AUC 0.98), SVM (AUC 0.70), XGBoost (AUC 0.96), and KNN (AUC 0.98). The x-axis shows the false positive rate, and the y-axis shows the true positive rate. Random Forest and KNN have the highest AUC values.
FIGURE 2
Plot of AUC comparison between different models.
Bar chart showing the average impact of variables on the model output magnitude, measured by mean SHAP values. DV has the highest impact, followed by UI, CRE, AGR, P, HP, BMI, CK, HCT, and DBIL.
FIGURE 3
Importance ranking of mortality risk in the KNN model.
Circular heatmap showing correlation between various features like EL, VAT, HTN, and others. The diagonal line represents perfect correlation. Color scale ranges from dark blue for low to yellow for high correlation.
FIGURE 4
Bubble heat map of correlations between significance features.
SHAP summary plot displaying the impact of various features on a model’s output. Features such as DV, UI, and CRE are shown along the y-axis. SHAP values on the x-axis range from -0.20 to 0.15, indicating feature impact direction and magnitude. Data points are colored from blue (low feature value) to red (high feature value).
FIGURE 5
Scatter plot of SHAP values for different features.
Scatter plots depict the impact of five variables on SHAP values. Panel A shows dialysis duration; Panel B, unbound iron; Panel C, creatinine; Panel D, albumin/globulin ratio; Panel E, serum phosphate. Each panel illustrates distinct data point distributions and trends.
FIGURE 6
SHAP dependency graph for different features.
Bar graph illustrating feature contributions to a model prediction, with values ranging from -0.1006 to 0.9994. Features impacting the prediction are listed below the bar, with the most significant negative influence from “UI” at -0.6027 and the most significant positive influence from “ALB” at 2.424. The base value is 0.4994, and the model prediction is 0.15. Blue represents positive contributions, while red indicates negative ones.
FIGURE 7
Single patient predictive SHAP force plot.

Similar articles

References

    1. Webster A, Nagler E, Morton R, Masson P. Chronic kidney disease. Lancet. (2017) 389:1238–52. 10.1016/S0140-6736(16)32064-5 - DOI - PubMed
    1. Cockwell P, Fisher L. The global burden of chronic kidney disease. Lancet. (2020) 395:662–4. 10.1016/S0140-6736(19)32977-0 - DOI - PubMed
    1. Wang L, Xu X, Zhang M, Hu C, Zhang X, Li C, et al. Prevalence of chronic kidney disease in China: Results from the Sixth China chronic disease and risk factor surveillance. JAMA Intern Med. (2023) 183:298–310. 10.1001/jamainternmed.2022.6817 - DOI - PMC - PubMed
    1. Dong S, Liu Y, Ge H, Lin Y, Guan W, Su W, et al. Trend analysis of chronic kidney disease morbidity and mortality in the Chinese population based on age-period-cohort modeling. Public Health Preventive Medicine. (2024) 35: 12–5.
    1. Zhang X, Li H, Chen Y, Zhao S. Influence of hemodialysis and peritoneal dialysis on survival in elderly patients with end-stage renal disease. J Xinjiang Med Univ. (2021) 44:76–9.

LinkOut - more resources