. 2025 May 15;7(3):152-165.
doi: 10.1016/j.bsheal.2025.05.004. eCollection 2025 Jun.

Longitudinal profiling of host response and oropharyngeal respiratory microbiome reveals dynamic alterations during recovery from community-acquired pneumonia

Affiliations

Longitudinal profiling of host response and oropharyngeal respiratory microbiome reveals dynamic alterations during recovery from community-acquired pneumonia

Lizhe Hong et al. Biosaf Health. .

Abstract

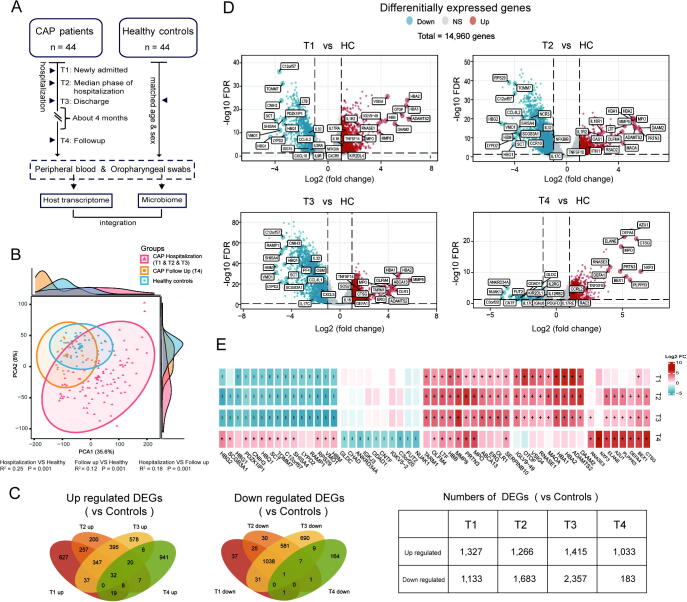
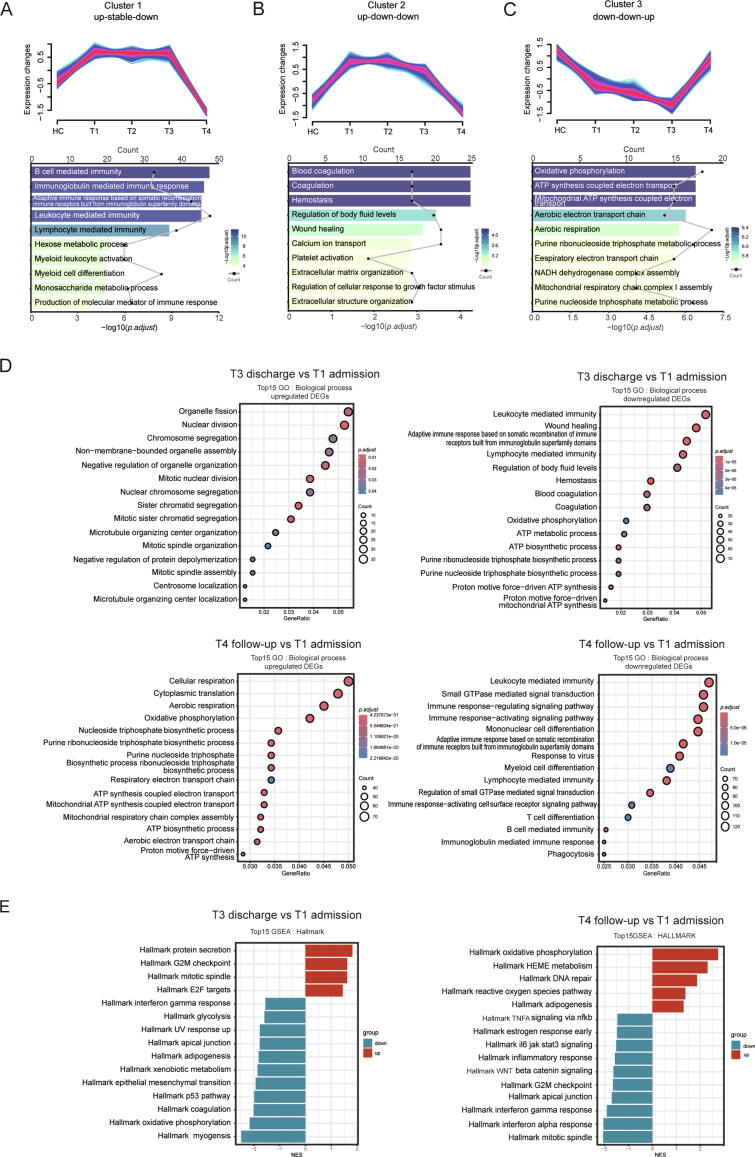
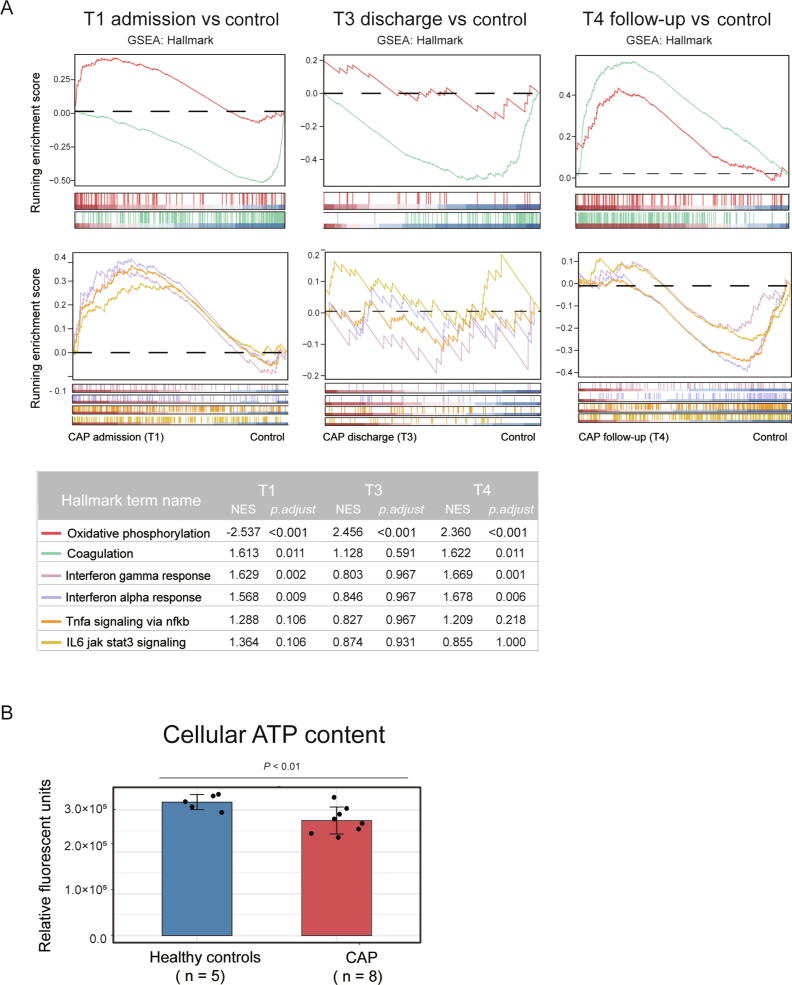
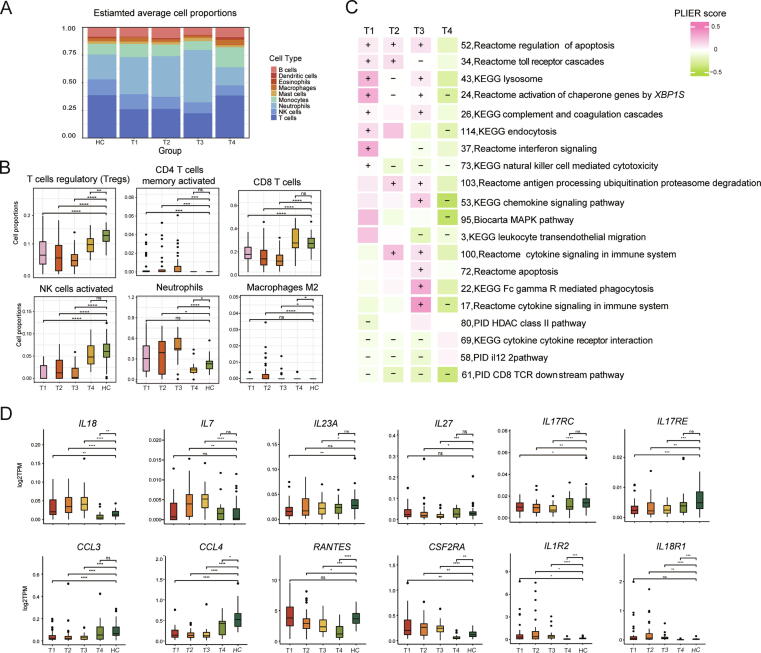
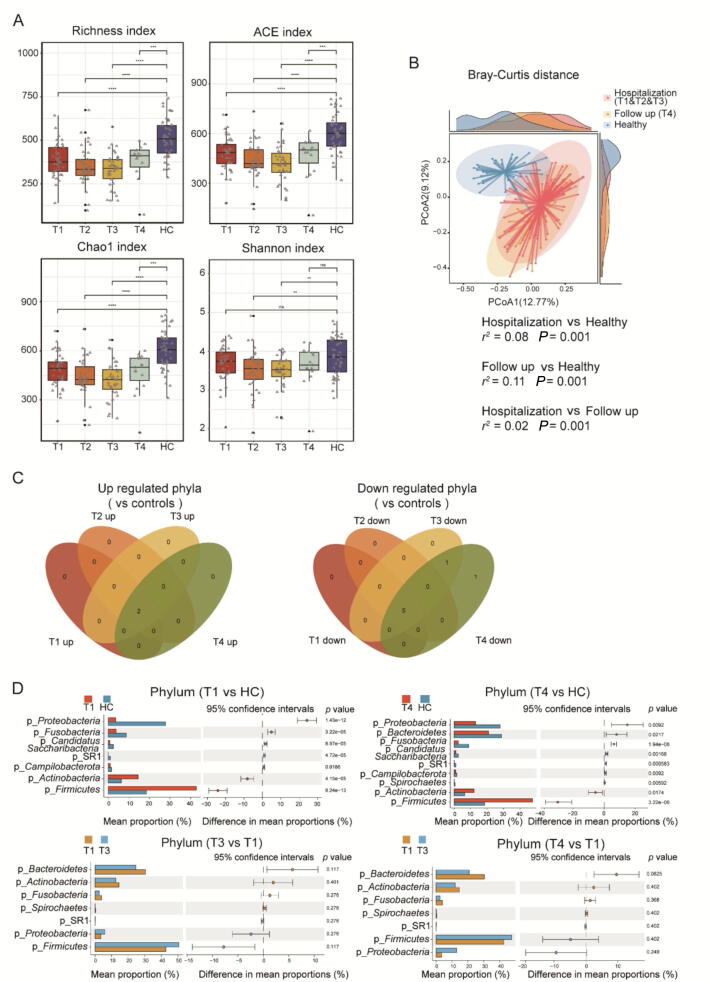
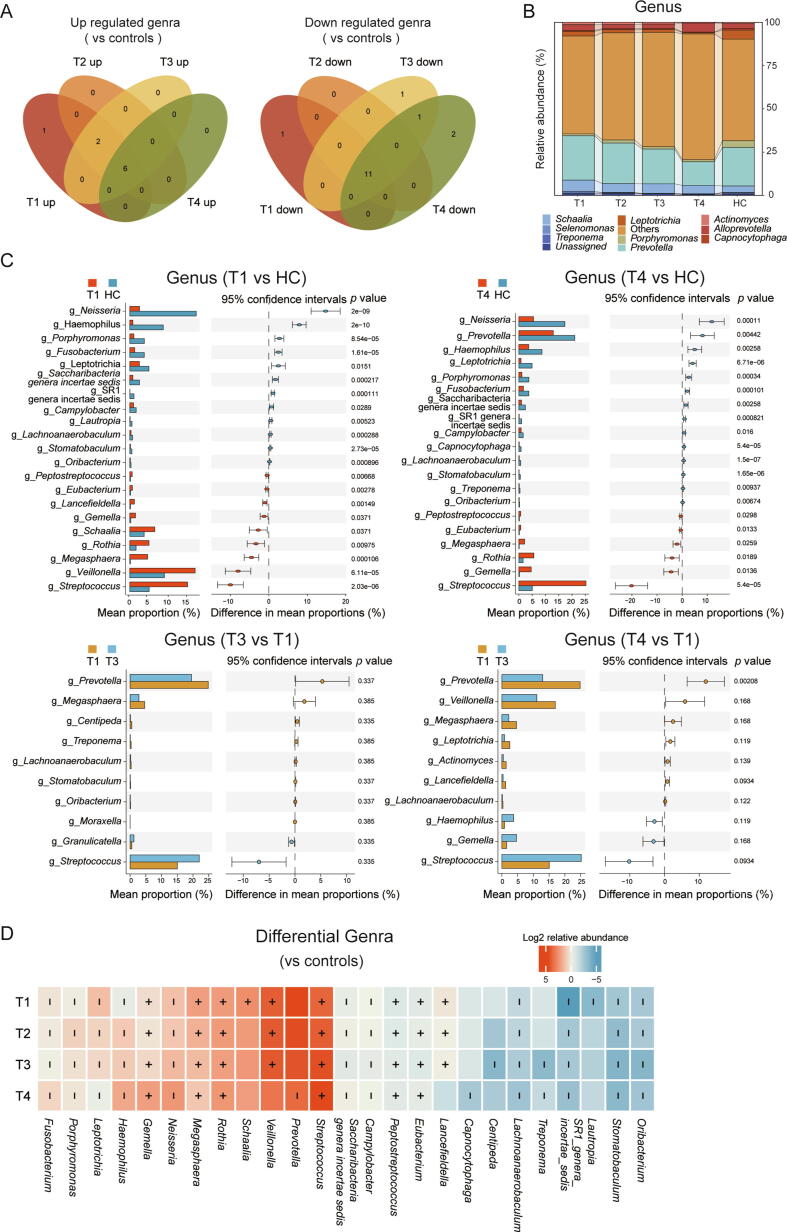
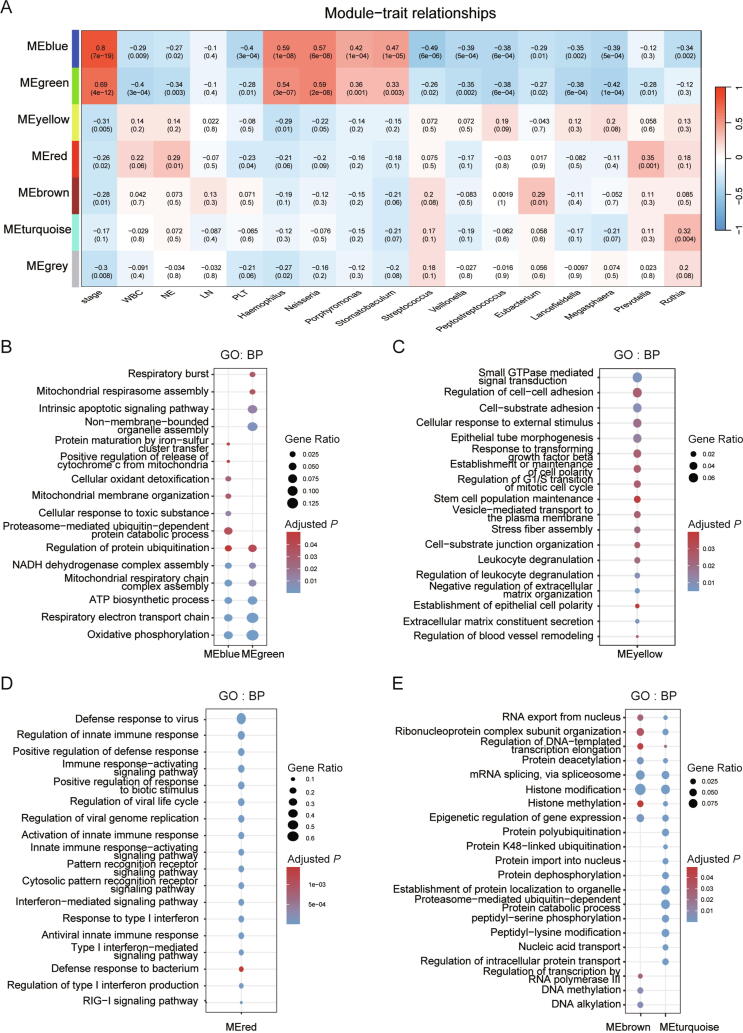
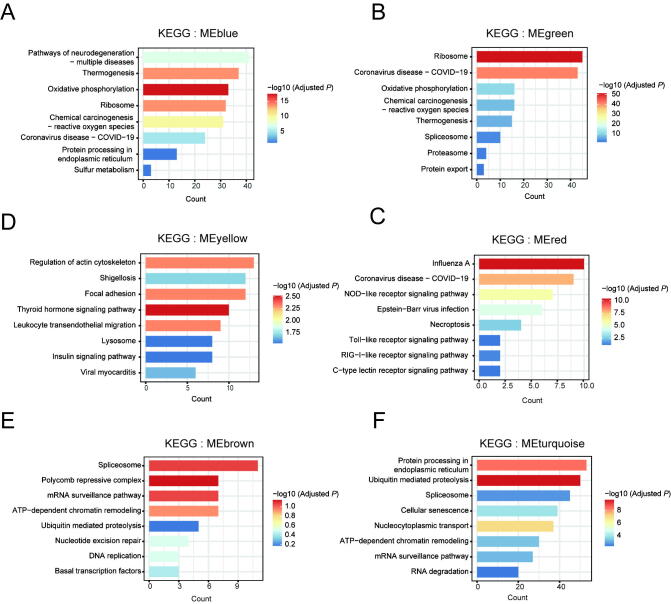
Community-acquired pneumonia (CAP) is a major global health concern, with limited understanding of longitudinal changes in host gene expression and respiratory microbiome throughout disease progression and recovery. To address this gap, we longitudinally collected CAP patients' peripheral blood for transcriptome and oropharyngeal swabs for microbiome analysis from admission to 4 months post infection. Age- and sex-matched volunteers were recruited as controls. We observed CAP patients mounted rapid, effective, and moderate immune responses against infection. Coagulation activation and mitochondrial dysfunction were the striking pathways showing distinct difference in CAP patients compared to controls, and the latter was validated by lower adenosine triphosphate (ATP) levels in the peripheral blood mononuclear cells (PBMCs) of CAP patients. Although transcriptional perturbations gradually decreased, they did not fully recover during the follow-up period. Similarly, persisting oropharyngeal microbiome dysbiosis was observed, characterized by significantly lower alpha diversity and altered taxonomy distribution (P < 0.05). CAP increased the relative abundance of Streptococcus, Veillonella, and Peptostreptococcus, while decreasing that of Haemophilus, Neisseria, and Porphyromonas. Integrated analysis of host response and oropharyngeal microbiome revealed that the relative abundance of Haemophilus, Neisseria, Porphyromonas, and Stomatobaculum were positively related to mitochondrial structure and function pathways, whereas the relative abundance of Prevotella declined over time in patients and positively correlated with anti-pathogen and interferon signaling pathways. These results underscore the persistent impact of CAP on both host immunity and oropharyngeal microbiome, even months after infection, emphasizing the need for long-term follow-up and targeted strategies to facilitate full recovery and restore homeostasis.

Keywords: Community-acquired pneumonia (CAP); Recovery; Respiratory microbiome; Transcriptome.


Figures

Fig. 1
Fig. 1
Identification of DEGs in CAP patients. A) Study design. Peripheral blood and oropharyngeal swabs were collected from patients at four timepoints. Samples from healthy people were served as controls. B) PCA plot showed significant difference on gene expression profiles among groups (PERMANOVA test or pair-wise PERMANOVA test). C) Venn diagrams of up or down regulated DEGs between CAP versus controls and detailed numbers. T1, admission status; T2, median phase of CAP hospitalization; T3, improved status; T4, convalescence. D) Volcano plots of DEGs per sampling timepoint. The names of protein-coding or immune-related genes with the top absolute FC were labelled. E) Heatmap of expression levels of top 10 protein-coding DEGs at different timepoints vs. healthy control group. “+” or “-” represented significantly upregulated or downregulated. For differential expression, |FC|>2 and FDR <0.05 were selected. Abbreviations: CAP, community-acquired pneumonia; DEG, differentially expressed gene; FC, fold change; FDR, false discovery rate.
Fig. 2
Fig. 2
Longitudinal transcriptomic hallmarks of CAP. A–C) Clustering plots of DEGs expression patterns (top) and top 10 enriched GO terms (bottom). The color of each bar stood for –log10 (adjusted P value) (Benjamini-Hochberg method) and dot for enrich count. D–E) Comparison within CAP patients at different timepoints by GO (D) and GSEA enrichment (E) with top 15 pathways shown. T1, admission status; T2, median phase of CAP hospitalization; T3, improved status; T4, convalescence. Abbreviations: CAP, community-acquired pneumonia; DEG, differentially expressed gene; GO, Gene Ontology; HC, healthy control.
Fig. 3
Fig. 3
Representative pathways of CAP. A) GSEA of representative pathways among patients and controls. T1, admission status; T2, median phase of CAP hospitalization; T3, improved status; T4, convalescence. B) Cellular ATP in PBMCs from CAP or controls was measured via a luciferase-based assay and expressed as relative fluorescent units. P value was determined using the Mann-Whitney U test, showing statistical significance. Error bars showed the mean ± SD. Adjusted P value was calculated using Benjamini-Hochberg method. Abbreviations: CAP, community-acquired pneumonia; GSEA, gene set enrichment analysis; PBMCs, peripheral blood mononuclear cells; ATP, adenosine triphosphate; SD, standard deviation; NADH, nicotinamide adenine dinucleotide (reduced form); UV, ultraviolet; GTPase, guanosine triphosphatase; DNA, deoxyribonucleic acid; TNFA, tumor necrosis factor alpha; NFKB, nuclear factor kappa B; IL6, interleukin-6; Jak, Janus kinase; Stat3, signal transducer and activator of transcription 3.
Fig. 4
Fig. 4
Dynamic alterations of CAP patients' immune profiles predicted from transcriptome data. A) The proportions of nine major immune cell types. B) Comparison of the representative immune cell proportions between CAP and healthy controls during recovery. C) Heatmap of representative immune-related latent variables with biological function per sampling time. Pathways that were significantly upregulated or downregulated according to the Mann-Whitney U test were labeled with “+” or “-”, respectively. T1, admission status; T2, median phase of CAP hospitalization; T3, improved status; T4, convalescence. D) Boxplots showed the gene expression of representative cytokines and receptors with time. Mann-Whitney U test was used. ns, P > 0.05; *, P ≤ 0.05; **, P ≤ 0.01; ***, P ≤ 0.001; ****, P ≤ 0.0001. Abbreviations: CAP, community-acquired pneumonia; NK, natural killer; CD, cluster of differentiation; KEGG, Kyoto Encyclopedia of Genes and Genomes; MAPK, mitogen-activated protein kinase; PID, pathway interaction database; IL, interleukin; CCL, C-C motif chemokine ligand; CSF, colony-stimulating factor.
Fig. 5
Fig. 5
Respiratory microbiome signatures of CAP during rehabilitation. A) Changes in the α-diversity (genus level) with time. Each triangle represented one swab specimen. B) The β-diversity was assessed by principal coordinates analysis (PCoA) of Bray-Curtis distance. r2 and significance were shown. PERMANOVA test or pairwise PERMANOVA test was used. C) Venn diagrams summarized the differential phyla of patients compared with controls. D) Detailed results of STAMP analysis at the phylum level. STAMP analysis was performed to distinguish the respiratory microbiome among groups (C–D). T1, admission status; T2, median phase of CAP hospitalization; T3, improved status; T4, convalescence. Abbreviations: CAP, community-acquired pneumonia; PERMANOVA, permutational multivariate analysis of variance; STAMP, statistical tool for analysis of metagenomic profiles; ACE, abundance-based coverage estimator; HC, healthy control.
Fig. 6
Fig. 6
Respiratory genus signatures of CAP during rehabilitation. A) Venn diagrams summarized the varied genera. B) Histogram displayed the microbial compositional profiling. C) Detailed STAMP analysis results at the genus level. D) Heatmap of differential genera. STAMP analysis was performed to distinguish the respiratory microbiome among groups (A–D). Mann-Whitney U test was used and significantly upregulated or downregulated genera were labelled with “+” or “-”. T1, admission status; T2, median phase of CAP hospitalization; T3, improved status; T4, convalescence. Abbreviations: CAP, community-acquired pneumonia; STAMP, statistical tool for analysis of metagenomic profiles; ACE, abundance-based coverage estimator; HC, healthy control.
Fig. 7
Fig. 7
WGCNA indicated the relationship between host transcriptome and microbiome. A) Correlations between WGCNA gene modules, clinical traits, and relative abundance of differential respiratory microbes. The correlation coefficient and adjusted P-value (in parentheses) were provided. Adjusted P value was calculated using Benjamini-Hochberg method. B–E) GO gene enrichment analysis for each module. The size of the bubble represented enriched GO gene ratio. Representative pathways were shown. Abbreviations: GO, gene ontology; BP, biological process; WGCNA, weighted correlation network analysis.
Fig. 8
Fig. 8
WGCNA indicated the relationship between host KEGG pathway and microbiome. A–F) KEGG analysis for modules. Representative pathways were shown. The colors of the bars (A–F) represented the -log10 (adjusted P) (Benjamini-Hochberg method). Abbreviations: WGCNA, weighted correlation network analysis; KEGG, Kyoto Encyclopedia of Genes and Genomes; NADH, nicotinamide adenine dinucleotide (reduced); ATP, adenosine triphosphate; GTPase, guanosine triphosphatase; RIG-I, retinoic acid-inducible gene I; DNA, deoxyribonucleic acid; RNA, ribonucleic acid; mRNA, messenger RNA; COVID-19, coronavirus disease 2019.

Similar articles

References

    1. Lozano R., Naghavi M., Foreman K., Lim S., Shibuya K., Aboyans V., Abraham J., Adair T., Aggarwal R., Ahn S.Y., et al. Global and regional mortality from 235 causes of death for 20 age groups in 1990 and 2010: A systematic analysis for the Global Burden of Disease Study 2010. Lancet. 2012;380:2095–2128. doi: 10.1016/s0140-6736(12)61728-0. - DOI - PMC - PubMed
    1. Meehan T.P., Fine M.J., Krumholz H.M., Scinto J.D., Galusha D.H., Mockalis J.T., Weber G.F., Petrillo M.K., Houck P.M., Fine J.M. Quality of care, process, and outcomes in elderly patients with pneumonia. JAMA. 1997;278:2080–2084. doi: 10.1001/jama.1997.03550230056037. - DOI - PubMed
    1. Troeger C., Blacker B., Khalil I.A., Rao P.C., Cao J., Zimsen S.R.M., Albertson S.B., Deshpande A., Farag T., Abebe Z., et al. Estimates of the global, regional, and national morbidity, mortality, and aetiologies of lower respiratory infections in 195 countries, 1990–2016: A systematic analysis for the Global Burden of Disease Study 2016. Lancet Infect. Dis. 2018;18:1191–1210. doi: 10.1016/s1473-3099(18)30310-4. - DOI - PMC - PubMed
    1. Zhang Y., Li Y., Sun N., Tang H., Ye J., Liu Y., He Q., Fu Y., Zhu H., Jiang C., Xu J. NETosis is critical in patients with severe community-acquired pneumonia. Front. Immunol. 2022;13:1–13. doi: 10.3389/fimmu.2022.1051140. - DOI - PMC - PubMed
    1. Scicluna B.P., Klein Klouwenberg P.M.C., van Vught L.A., Wiewel M.A., Ong D.S., Zwinderman A.H., Franitza M., Toliat M.R., Nürnberg P., Hoogendijk A.J., et al. A Molecular biomarker to diagnose community-acquired pneumonia on intensive care unit admission. Am. J. Respir. Crit. Care Med. 2015;192:826–835. doi: 10.1164/rccm.201502-0355oc. - DOI - PubMed

LinkOut - more resources