

Quantitative analysis of targeted lipidomics in the hippocampus of APP/PS1 mice employing the UHPLC-MS/MS method
- PMID: 40693114
- PMCID: PMC12277340
- DOI: 10.3389/fnagi.2025.1561831
Quantitative analysis of targeted lipidomics in the hippocampus of APP/PS1 mice employing the UHPLC-MS/MS method
Abstract
Background: Alzheimer's disease (AD) is marked by the pathological features of amyloid-β plaque accumulation, as well as intracellular neurofibrillary tangles formation in the patients' brain. Aberrant lipid metabolism is increasingly recognized as one of the important contributors to AD.
Purpose: The main goal of this research was to conduct quantitative detection of targeted lipidomics in hippocampal tissue of APPSwe/PS1dE9 mice in order to identify lipid metabolic biomarkers of early-onset AD mice.
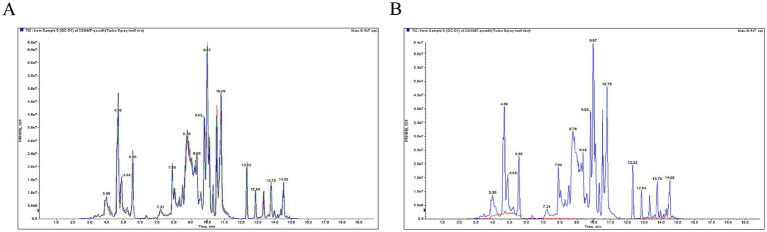
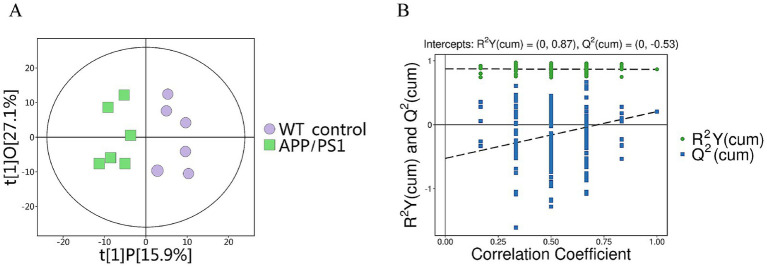
Methods: Our approach departs from conventional lipid detection methods, employing a highly accurate quantificational Ultra High Performance Liquid Chromatography Tandem Mass Spectrometry (UHPLC-MS/MS) technique to analyze targeted lipid biomarkers. The innovative method was utilized to detect targeted lipids in the hippocampus of AD and wild-type mice. Statistical method was performed by Student's t-test and multivariate analysis. Differential metabolites were identified through fulfilling the standard of Variable Importance in Projection surpassing one and the significance probability lower than 0.05 thresholds.
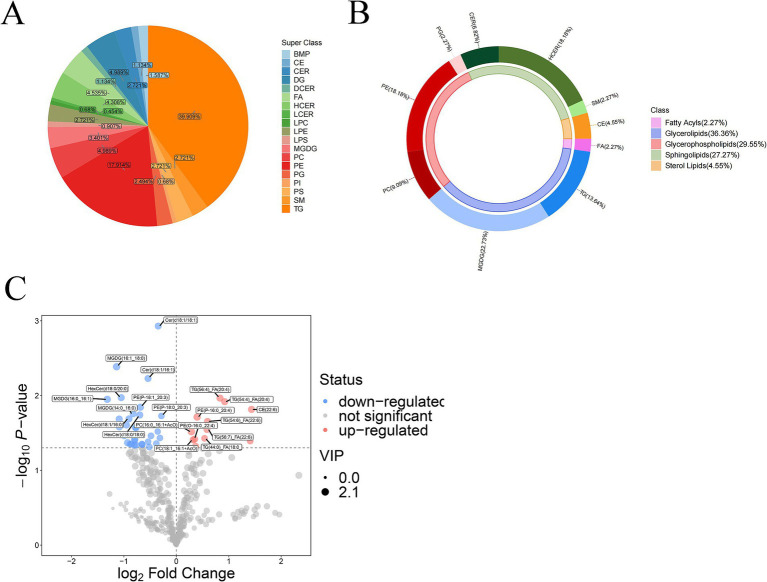
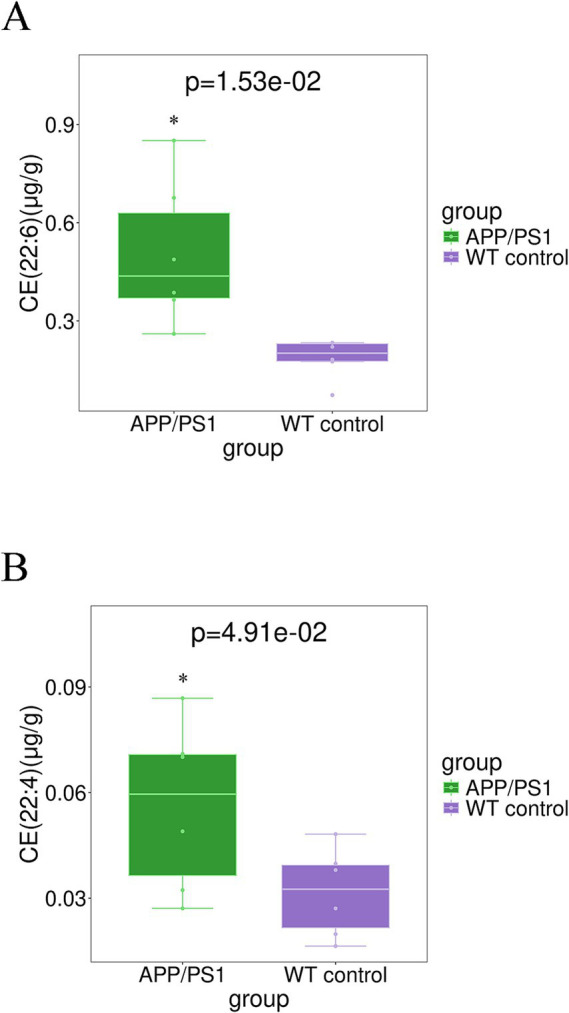
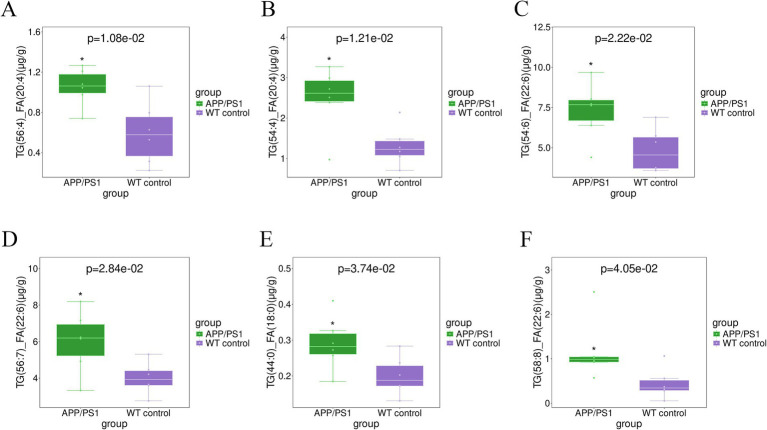
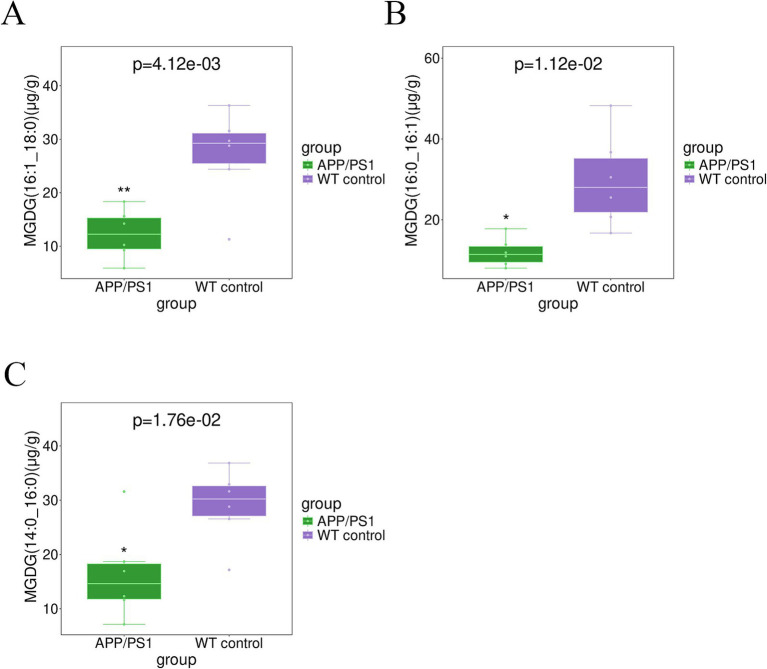
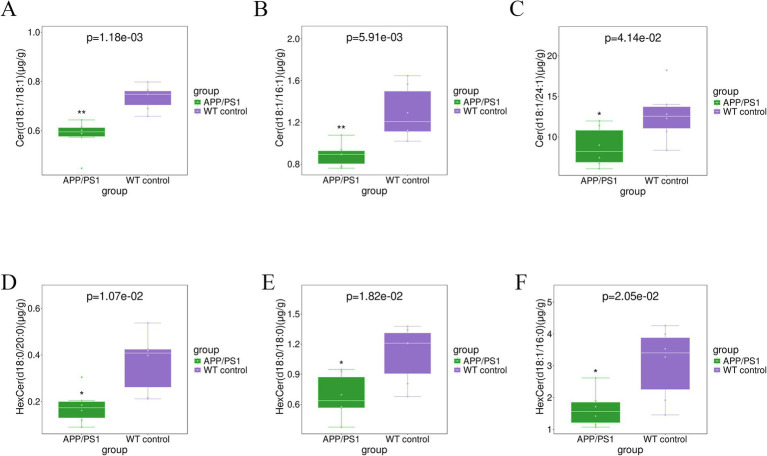
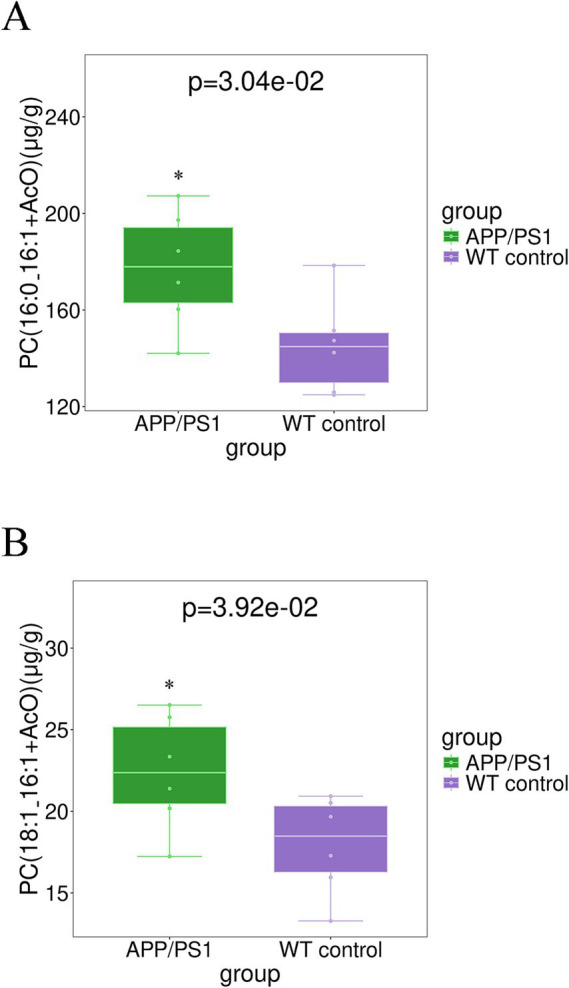
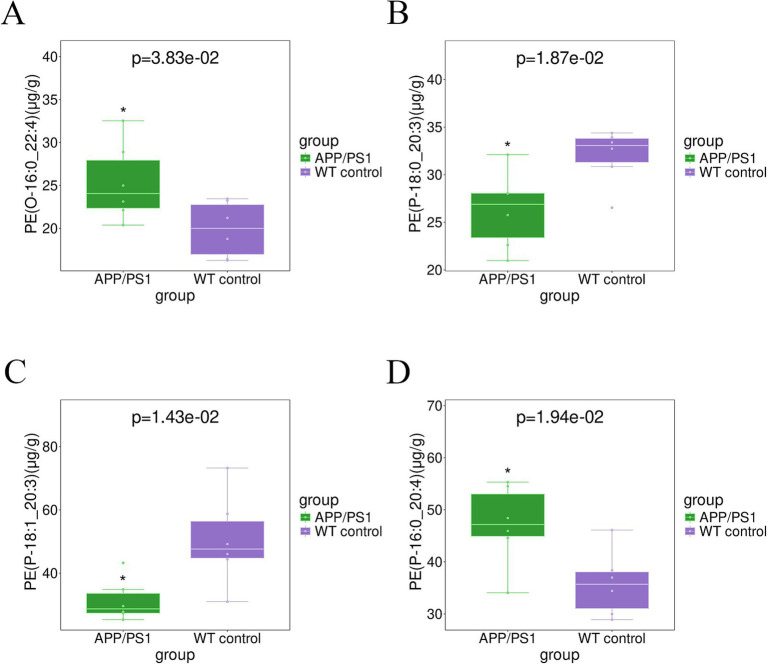
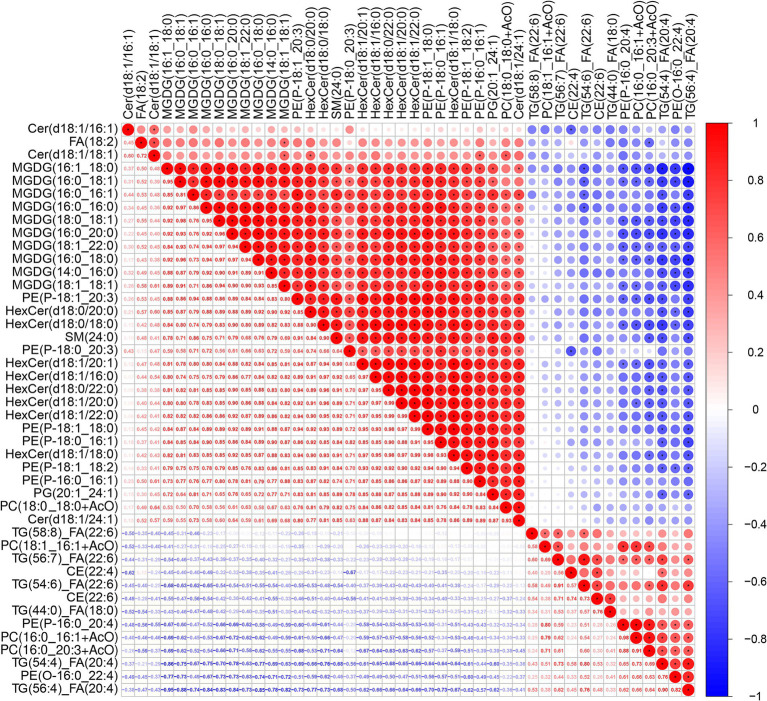
Results: Both groups utilized identical methodologies and adhered strictly to standardized treatment protocols. Sphingolipids (SPs), Glycerophospholipids (GPs), Glycolipids, Glycerides (GLs), Sterol Lipids (STs), and Free Fatty Acid (FA) were identified as prominent lipids exhibiting alterations in the hippocampus of AD models. Regarding glycolipid and glycerolipid composition, monogalactosyldiacylglycerols (MGDGs) and Triacylglycerols (TGs) constituted a significant proportion (p < 0.05, VIP > 1). Among glycerophospholipids, phosphatidylethanolamines (PEs) and phosphatidylcholines (PCs) emerged as significant constituents (p < 0.05, VIP > 1). Furthermore, hexosylceramides (HexCers) and ceramides (Cers) in the AD model's hippocampus, the prominent sphingolipids in the hippocampus of AD mice, existed as the two primary changed lipid metabolites. The levels of some TGs in GLs and CEs in STs showed a significant elevation (p < 0.05, VIP > 1). In contrast, most kinds of MGDGs, HexCers, Cers, PEs and FA (18:2) demonstrated a notable decrease in the hippocampus of AD group (p < 0.05, VIP > 1).
Conclusion: The present research represents the important quantitative identification of distinct lipid biomarker profiles within the hippocampal portion of 7.5-month-aged AD mice. It encompasses glycolipid, GLs, GPs, SPs, STs, and FAs using a targeted HPLC-MS method for quantification. These findings suggest potential diagnostic lipid biomarkers in hippocampus of early-onset AD mice related to cellular membrane integrity, atherosclerosis, oxidative stress damage, and inflammation.
Keywords: APP/PS1 mice; Alzheimer’s disease; UHPLC-MS; hippocampus; targeted lipidomics.
Copyright © 2025 Xiao, Wei, Han, Shi, Wei, Liang, Sun, Zhang, Han and Shen.
Conflict of interest statement
The authors declare that the research was conducted in the absence of any commercial or financial relationships that could be construed as a potential conflict of interest.
Figures
Similar articles
-
The Black Book of Psychotropic Dosing and Monitoring.Psychopharmacol Bull. 2024 Jul 8;54(3):8-59. Psychopharmacol Bull. 2024. PMID: 38993656 Free PMC article. Review.
-
Comprehensive and high-coverage glycerophospholipidomic analysis based on iterative quadrupole time-of-flight mass spectrometry and its application in cerebral ischemia-reperfusion injury.Anal Bioanal Chem. 2025 Jul;417(16):3621-3632. doi: 10.1007/s00216-025-05884-2. Epub 2025 May 6. Anal Bioanal Chem. 2025. PMID: 40327074
-
Are Current Survival Prediction Tools Useful When Treating Subsequent Skeletal-related Events From Bone Metastases?Clin Orthop Relat Res. 2024 Sep 1;482(9):1710-1721. doi: 10.1097/CORR.0000000000003030. Epub 2024 Mar 22. Clin Orthop Relat Res. 2024. PMID: 38517402
-
Short-Term Memory Impairment.2024 Jun 8. In: StatPearls [Internet]. Treasure Island (FL): StatPearls Publishing; 2025 Jan–. 2024 Jun 8. In: StatPearls [Internet]. Treasure Island (FL): StatPearls Publishing; 2025 Jan–. PMID: 31424720 Free Books & Documents.
-
CSF tau and the CSF tau/ABeta ratio for the diagnosis of Alzheimer's disease dementia and other dementias in people with mild cognitive impairment (MCI).Cochrane Database Syst Rev. 2017 Mar 22;3(3):CD010803. doi: 10.1002/14651858.CD010803.pub2. Cochrane Database Syst Rev. 2017. PMID: 28328043 Free PMC article.
References
-
- Adibhatla R. M., Hatcher J. F., Larsen E. C., Chen X., Sun D., Tsao F. H. (2006). CDP-choline significantly restores phosphatidylcholine levels by differentially affecting phospholipase A2 and CTP: phosphocholine cytidylyltransferase after stroke. J. Biol. Chem. 281, 6718–6725. doi: 10.1074/jbc.M512112200, PMID: - DOI - PubMed
LinkOut - more resources
Full Text Sources
Research Materials
Miscellaneous