Reducing enteric methane emission in dairy goats: impact of dietary inclusions of quebracho tannin extract on ruminal microbiota
- PMID: 40693138
- PMCID: PMC12277267
- DOI: 10.3389/fmicb.2025.1595924
Reducing enteric methane emission in dairy goats: impact of dietary inclusions of quebracho tannin extract on ruminal microbiota
Abstract
Introduction: Condensed tannins (CT) influence ruminal microbiota, feed digestibility, and methane emissions, yet their effects in goats are poorly understood.
Methods: This study evaluated the impact of dietary quebracho CT extract at 0%, 2%, 4%, or 6% of dry matter on the composition of the dairy goat ruminal microbiota with a two-times repeated 4 × 4 Latin square design. Bacterial, archaeal, fungal, and protozoan communities were analyzed at the end of each feeding period for relative abundance changes, and their relationship to methane production, nutrient digestibility and feed efficiency were also assessed.
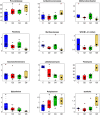
Results: Increasing CT levels reduced alpha- and beta-diversity, with the 6% CT diet showing the most pronounced decline. CT inclusion induced phylum-level shifts in fiber-degrading microbes, including inversion of the Firmicutes to Bacteroidota ratio. Prevotellaceae and Succiniclasticum, tolerant to CT, increased significantly (P < 0.05), in line with higher propionate and lower methane production. The proteolytic bacteria Anaerolineaceae and Synergistaceae decreased (P < 0.05), consistently with the reduced isobutyrate and isovalerate ruminal concentration and with the reduced urinary nitrogen excretion. Methanobrevibacter, a key methane producer, was reduced by dietary CT (P < 0.05). The overall fungal biodiversity was also significantly changed (P < 0.05); the fiber-degrading Liebetanzomyces decreased, while the tannin-degrading Aspergillus increased (P < 0.05). Concerning protozoa, Diplodinium was reduced (P < 0.05) and Polyplastron and Isotrichia were increased (P < 0.05) by dietary CT.
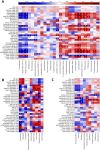
Discussion: These and other microbial abundance changes correlated with reduced methane emission, altered fiber and protein digestibility, and modified volatile fatty acid (VFA) profiles. This study shows that decreased nutrient degradability in the rumen due to higher dietary CT alters the goat rumen microbiota and clarifies microbial taxa changes in relation to the zootechnical outcomes, including reduced methane production.
Keywords: condensed tannins; environmental sustainability; methanogenesis; microbiota modulation; rumen fermentation.
Copyright © 2025 Cremonesi, Severgnini, Battelli, Monistero, Penati, Gazzonis, Castiglioni, Rapetti, Manfredi and Addis.
Conflict of interest statement
The authors declare that the research was conducted in the absence of any commercial or financial relationships that could be construed as a potential conflict of interest. The author(s) declared that they were an editorial board member of Frontiers, at the time of submission. This had no impact on the peer review process and the final decision.
Figures


Similar articles
-
Characterization of the ruminal microbiota in sheep and goats fed different levels of tannin-rich Sericea lespedeza hay.J Anim Sci. 2024 Jan 3;102:skae198. doi: 10.1093/jas/skae198. J Anim Sci. 2024. PMID: 39018107 Free PMC article.
-
Whole stillage inclusion level influences in vitro fiber digestibility and ruminal fermentation of tall fescue hay.J Anim Sci. 2025 Jan 4;103:skaf006. doi: 10.1093/jas/skaf006. J Anim Sci. 2025. PMID: 39821336
-
Effects of dietary supplementation of nitrate on enteric methane production, performance, and rumen microbiome of Hanwoo steers.J Anim Sci. 2025 Jan 4;103:skaf109. doi: 10.1093/jas/skaf109. J Anim Sci. 2025. PMID: 40231431
-
Approaches for predicting dairy cattle methane emissions: from traditional methods to machine learning.J Anim Sci. 2024 Jan 3;102:skae219. doi: 10.1093/jas/skae219. J Anim Sci. 2024. PMID: 39123286 Free PMC article.
-
International Symposium on Ruminant Physiology: The role of rumen microbiome in the development of methane mitigation strategies for ruminant livestock.J Dairy Sci. 2025 Jul;108(7):7591-7606. doi: 10.3168/jds.2024-25778. Epub 2025 Jan 29. J Dairy Sci. 2025. PMID: 39890073 Review.
References
-
- Abarenkov K., Zirk A., Piirmann T., Pöhönen R., Ivanov F., Nilsson R. H., et al. (2021). UNITE QIIME release for Fungi. Version 10.05, 2021.
-
- Battelli M., Colombini S., Crovetto G. M., Galassi G., Abeni F., Petrera F., et al. (2024). Condensed tannins fed to dairy goats: effects on digestibility, milk production, blood parameters, methane emission, and energy and nitrogen balances. J. Dairy Sci. 107:3614–30. 10.3168/jds.2023-24076 - DOI - PubMed
-
- Battelli M., Colombini S., Parma P., Galassi G., Crovetto G. M., Spanghero M., et al. (2023). In vitro effects of different levels of quebracho and chestnut tannins on rumen methane production, fermentation parameters, and microbiota. Front. Vet. Sci. 10:1178288. 10.3389/fvets.2023.1178288 - DOI - PMC - PubMed
LinkOut - more resources
Full Text Sources

