. 2025 Jul 22;10(14):e180752.
doi: 10.1172/jci.insight.180752.

A hypomorphic Mpi mutation unlocks an in vivo tool for studying global N-glycosylation deficiency

Affiliations

A hypomorphic Mpi mutation unlocks an in vivo tool for studying global N-glycosylation deficiency

Elisa B Lin et al. JCI Insight. .

Abstract

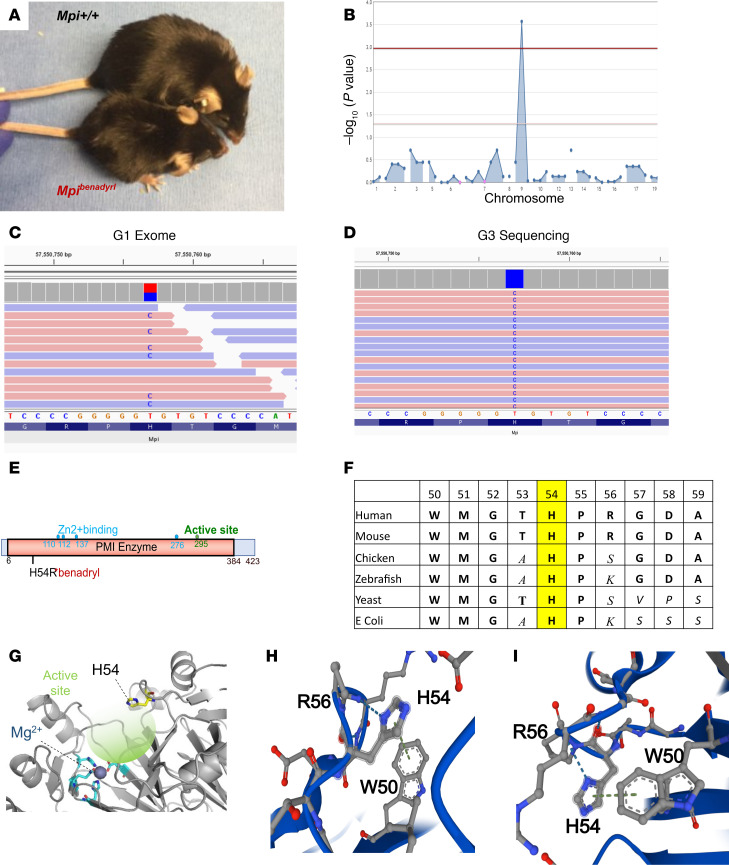
Glycans are one of the 4 major macromolecules essential for life and are the most abundant family of organic molecules. However, in contrast with DNA and RNA, glycan structures have no template; this results in limited tools to study this challenging macromolecule with a diversity of glycan structures. A central bottleneck in studying glycosylation in vivo is that inhibitors and complete KOs are lethal. In a forward genetic screen, we identified a viable, hypomorphic mutation at a conserved site in mannose phosphate isomerase (Mpi) that causes a multisystemic phenotype affecting RBCs, liver, stomach, intestines, skin, size, fat, and fluid balance in mice. The phenotype could be rescued with mannose. Analyses of glycopeptides in mice with this mutation showed a 500% increase in unoccupied N-glycan sites. This is equivalent to a "glycan knockdown," which would be useful for examining the role of glycans in biology and disease. Therefore, we report an in vivo tool to study global N-glycosylation deficiency with tissue-specific targeting and a rescue mechanism with mannose.

Keywords: Gastroenterology; Genetic diseases; Genetics; Glycobiology; Mouse models.


Conflict of interest statement

Conflict of interest: The authors have declared that no conflict of interest exists.

Figures

Figure 1
Figure 1. Benadryl has a viable, hypomorphic allele of Mpi, which causes a small body size and ruffled fur phenotype.
(A) Photograph of benadryl mouse (bottom) compared with WT littermate. (B) Manhattan plot. Linkage of a “visible, abnormal phenotype” to a mutation in Mpi −log10 (P values) versus the chromosomal positions of mutations identified in the founder (generation 1, G1) of the affected pedigree, determined by (C) whole-exome sequencing and validated by (D) ion torrent next-generation sequencing of all G3 progeny. (E) Schematic of Mpi domains and the substitution of histidine to arginine at position 54 of 423 total amino acids. Numbers indicate amino acid positions. PMI enzyme, phosphomannose isomerase enzyme domain, also known as MPI. (F) Table showing conservation of amino acids at and adjacent to p.H54 (highlighted) across multiple organisms back to prokaryotes. (G) Structure of Mpi indicating H54 (yellow), active site binding pocket (highlighted in green; darker color is deeper portion and lighter color faces outward), and divalent cation-binding amino acids (blue). (H and I) Intermolecular N-N interaction of H54 with R56 and aromatic ring interactions of H54 and W50 shown from 2 orientations.
Figure 2
Figure 2. Benadryl variant decreases enzyme activity and substrate binding affinity, causing broad hypoglycosylation.
(A) Mpi RNA analysis of peripheral mononuclear blood cells from Mpi+/+ or Mpiben/ben mice; Mpi RNA normalized by levels of GAPDH. (B) Mpi protein expression in tissues from Mpi+/+ or Mpiben/ben mice. (C) Enzyme activity was measured by generation of NADPH from mannose-6-phosphate (M6P) upon the addition of cell lysate obtained from peripheral blood. Initial velocity slope, V0 (nM/min), was measured across a range of M6P concentrations (0.306–8 mM). P values were determined by Student’s t test. Nonlinear regression of Michaelis-Menten kinetics was used by GraphPad to calculate VMax and the Km. (D) Mpi enzyme activity was calculated as NADPH generated (nmol)/min/protein from cell lysate (μg) for Mpi+/+ (n = 4), Mpi+/ben (n = 3), or Mpiben/ben mice (n = 4). (E) Glycan mass spectrometry reveals there are more unoccupied glycan sites in benadryl mice than in WT mice; (F) there is a difference when comparing glycoforms with 2 arms compared with 3 or more arms, but it is not as appreciable; (GI) there is no significant difference when comparing nonbisected to bisected forms, nonsialylated to sialylated forms, or non-fucosylated to fucosylated forms. (J) For example, an abundant glycoprotein, pregnancy zone protein (PZP), reveals more unoccupied sites in benadryl mice than in WT across multiple sites. (K) Mass spectrometry data for PZP site [567–585]. Data are representative of 2 (A and B) or 3 (C and DJ) experiments, and n = 3 benadryl and n = 4 WT mice (EK). Black = WT, green = Mpi+/ben, and red = Mpiben/ben. P values were determined by Student’s t test. **P < 0.01, ****P < 0.0001.
Figure 3
Figure 3. Metabolism is intact in benadryl mice.
(A) Fasting blood glucose after 6 hours of fasting in Mpi+/+, Mpi+/ben, or Mpiben/ben mice (n = 16, 9, 16). (B) Intraperitoneal glucose tolerance test was performed after 6 hours of fasting. Blood glucose was measured over 2 hours for Mpi+/+ and Mpiben/ben mice (n = 11, 8). (C) Fasting insulin was measured by ELISA in Mpi+/+ and Mpiben/ben mice (n = 9, 7). (D) H&E-stained histologic sections showing Mpi+/+ and Mpiben/ben pancreatic islets. Scale bar is 50 mm. (E) Probability of survival (hash marks indicate mice lost to follow-up) and (F and G) BWs of male and female mice over time in Mpi+/+, Mpi+/ben, and Mpiben/ben mice (male: n = 5, 2, 8, female: n = 7, 3, 5). Data combined from 2 experiments (A and EG) or performed once (B and C). Data points represent individual mice. Error bars indicate SD. P values were determined by 1-way ANOVA with Tukey’s multiple comparisons test (A), 2-way ANOVA with Bonferroni’s correction (B), Student’s t test (C), and mixed effects analysis with Tukey’s multiple comparisons test (F and G). **P < 0.01, ***P < 0.001, ****P < 0.0001. Lines in histology images represent 100 µm.
Figure 4
Figure 4. Mpi deficiency causes a microcytic, hypochromic iron deficiency anemia due to causes extrinsic to hematopoietic cells.
(A) Serum iron was measured by the VITROS 350 System in Mpi+/+ and Mpiben/ben mice (n = 18, 8). (B) RBC indices included RBC count, hemoglobin (Hgb), mean corpuscular volume (MCV), and mean corpuscular hemoglobin content (MCHC) in Mpi+/+ and Mpiben/ben mice (n = 4, 9). (C) Reciprocal BM chimeras between CD45.1 (black) and Mpiben/ben (red) mice (n = 4, 7) were performed by transplanting BM into lethally irradiated mice (lightning symbol). (D) RBC number, Hgb, MCV, and MCHC of CD45.1 mice transplanted with Mpiben/ben BM (black and white circles: n = 4) or Mpiben/ben mice transplanted with CD45.1 BM (red and black circle: n = 7). Data were combined from 2 experiments (A) or 1 experiment (BD). Data points represent individual mice. Error bars indicate SD. P values were determined by Student’s t test (A, B, and D). *P < 0.05, **P < 0.01, ***P < 0.001, ****P < 0.0001.
Figure 5
Figure 5. Liver and gastrointestinal tract are histologically and biochemically abnormal in Mpi-deficient mice.
(A) Gross examination of benadryl mouse shows an enlarged gallbladder. (B) Representative histologic sections were stained with H&E, periodic acid–Schiff (PAS), trichrome, or Oil Red O in WT (top) or Mpiben/ben mice (bottom). (C and D) Aspartate aminotransferase (AST) and alanine transaminase (ALT) were measured in Mpi+/+ and Mpiben/ben mice (n = 18, 8 for AST/ALT). (E) Antithrombin III (ATIII) and (F) insulin like growth factor 1 (IGF-1) levels were measured in 10-month-old Mpi+/+, Mpi+/ben, and Mpiben/ben littermates (ATIII: n = 5, 7, 7, IGF-1: n = 5, 8, 3). (G and H) Gross and microscopic images of Mpi+/+ and Mpiben/ben stomachs, focusing on the foregut. (I and J) H&E-stained small and large intestine tissues from Mpi+/+ and Mpiben/ben mice (arrows = goblet cells, arrowheads = immature goblet cells). (K) Serum total protein was measured by the VITROS 350 System in Mpi+/+ and Mpiben/ben mice (n = 18, 8). (L and M) Whole-body DEXA scan was used to measure lean soft tissue, adipose tissue, and fluid in total or as a percentage of total mass in Mpi+/+ and Mpiben/ben mice (n = 4, 8). Data points represent individual mice from the aggregate of 2 experiments (CF and K) or a single experiment (L and M). Black scale bars = 100 µm. Error bars indicate SD. P values were determined by Student’s t test (C, D, and KM) or CRISPR-calculator (55, 63) for recessive inheritance. **P < 0.01, ***P < 0.001, ****P < 0.0001. Lines in histology images represent 100 µm.
Figure 6
Figure 6. Anemia and low BW are caused by intestine-specific Mpi deficiency.
(A) RBC indices measured are RBC count, Hgb, MCV, and MCHC in Mpifl/+, Mpifl/fl, Mpifl/+ AlbCre, and Mpifl/fl AlbCre mice (n = 8, 6, 5, 5), along with BW (n = 8, 6, 5, 4). (B) RBC count, Hgb, MCV, and MCHC in Mpifl/+, Mpifl/fl, Mpifl/+ VillinCre, and Mpifl/fl VillinCre mice (n = 4, 6, 10, 4) and BW (n = 6, 3, 4, 15, 6). (C) Representative flow cytometry plots using thiazole orange and CD71 to determine reticulocyte count in peripheral blood and (D) quantification of RBC precursors and reticulocytes. (E) Serum total protein in Mpifl/+, Mpifl/fl, Mpifl/+ AlbCre, and Mpifl/fl AlbCre mice (n = 8, 6, 5, 5) and Mpifl/fl, Mpifl/+, Mpifl/+ VillinCre, and Mpifl/fl VillinCre mice (n = 7, 2, 6, 6). (F) Stool lysates for Mpi+/+, Mpiben/ben, Mpifl/fl, and MpiΔVillin mice with corresponding Hemoccult card reactions below. Hemoccult test results quantified on the right, WT, Mpiben/ben, Mpifl/fl, VillinCre, Mpifl/+ VillinCre, and Mpifl/fl VillinCre mice (n = 12, 4, 4, 2, 4, 4). Data points represent individual mice from the aggregate of 2 experiments (A, B, E, and F) or 3 independent experiments (C and D). Error bars indicate SD. P values were determined by 1-way ANOVA with post hoc Tukey’s test (AF). *P < 0.05, **P < 0.01, ***P < 0.001, ****P < 0.0001.
Figure 7
Figure 7. Histopathology of stomach and colon linked to intestinal Mpi deficiency.
(A) Histological sections of the liver visualized with H&E stain (left), trichrome stain (middle), and PAS stain (right); stomach and colon were stained with H&E, and the colon was further stained with Alcian blue to highlight mucins. Scale bar is 50 mm. (B) Serum ALT and AST were measured in Mpifl/+, Mpifl/fl, Mpifl/+ AlbCre, and Mpifl/fl AlbCre mice (n = 8, 6, 5, 5) and (C) Mpifl/+, Mpifl/fl, Mpifl/+ VillinCre, and Mpifl/fl VillinCre mice (n = 7, 6, 6, 6). Histologic images are representative of 5 independent mice (A). Data points represent individual mice from the aggregate of 3 experiments (B and C). Error bars indicate SD. P values were determined by 1-way ANOVA with post hoc Tukey’s test. *P < 0.05, **P < 0.01. Lines in histology images represent 100 µm.
Figure 8
Figure 8. Oral mannose therapy rescues Mpi deficiency.
(A) Mpiben/ben mice were treated with 2% mannose in drinking water for 30 days total. Photographs were taken on day 0 (left) and day 10 (right). (B) Relative changes in body weight of MpiWT/Het (Mpi+/+ or Mpiben/+) or Mpiben/ben mice after treatment with water (white fill, n = 5, 4) or 2% mannose (blue fill, n = 2, 6). (C) Microscopic images of colon and liver tissue from benadryl mice treated with water (left) or 2% mannose (right) for 30 days (200× original magnification, representative of 4–5 mice). Points represent mean values for mice that are representative of 3 experiments (B). Error bars indicate SEM. **P < 0.01, ***P < 0.001, ****P < 0.0001. Lines in histology images represent 25 μm.

Similar articles

References

    1. Apweiler R, et al. On the frequency of protein glycosylation, as deduced from analysis of the SWISS-PROT database. Biochim Biophys Acta. 1999;1473(1):4–8. doi: 10.1016/S0304-4165(99)00165-8. - DOI - PubMed
    1. Lin CW, et al. A common glycan structure on immunoglobulin G for enhancement of effector functions. Proc Natl Acad Sci U S A. 2015;112(34):10611–10616. doi: 10.1073/pnas.1513456112. - DOI - PMC - PubMed
    1. Stowell SR, et al. Protein glycosylation in cancer. Annu Rev Pathol. 2015;10:473–510. doi: 10.1146/annurev-pathol-012414-040438. - DOI - PMC - PubMed
    1. Schnaar RL. Glycobiology simplified: diverse roles of glycan recognition in inflammation. J Leukoc Biol. 2016;99(6):825–838. doi: 10.1189/jlb.3RI0116-021R. - DOI - PMC - PubMed
    1. Wright JLN, et al. O-GlcNAcylation and cardiovascular disease. Biochem Soc Trans. 2017;45(2):545–553. doi: 10.1042/BST20160164. - DOI - PMC - PubMed

LinkOut - more resources