. 2025 Jul;14(7):e70128.
doi: 10.1002/jev2.70128.

Proteomic Analysis of Extracellular Vesicles Identifies CDCP1 as Critical Metastasis-Related Glycoprotein in Lung Cancer

Affiliations

Proteomic Analysis of Extracellular Vesicles Identifies CDCP1 as Critical Metastasis-Related Glycoprotein in Lung Cancer

Lu Zhang et al. J Extracell Vesicles. 2025 Jul.

Abstract

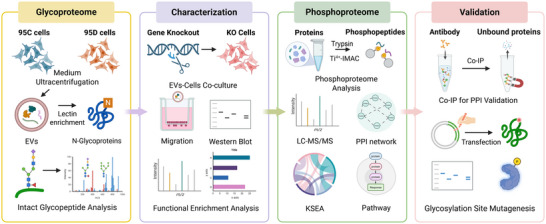
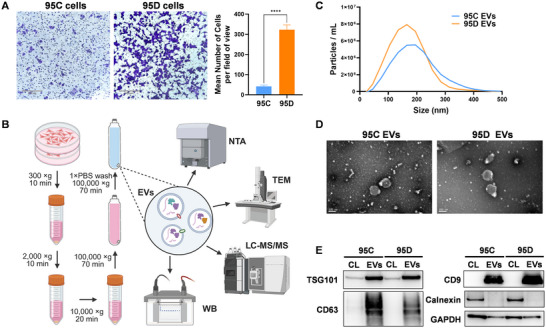
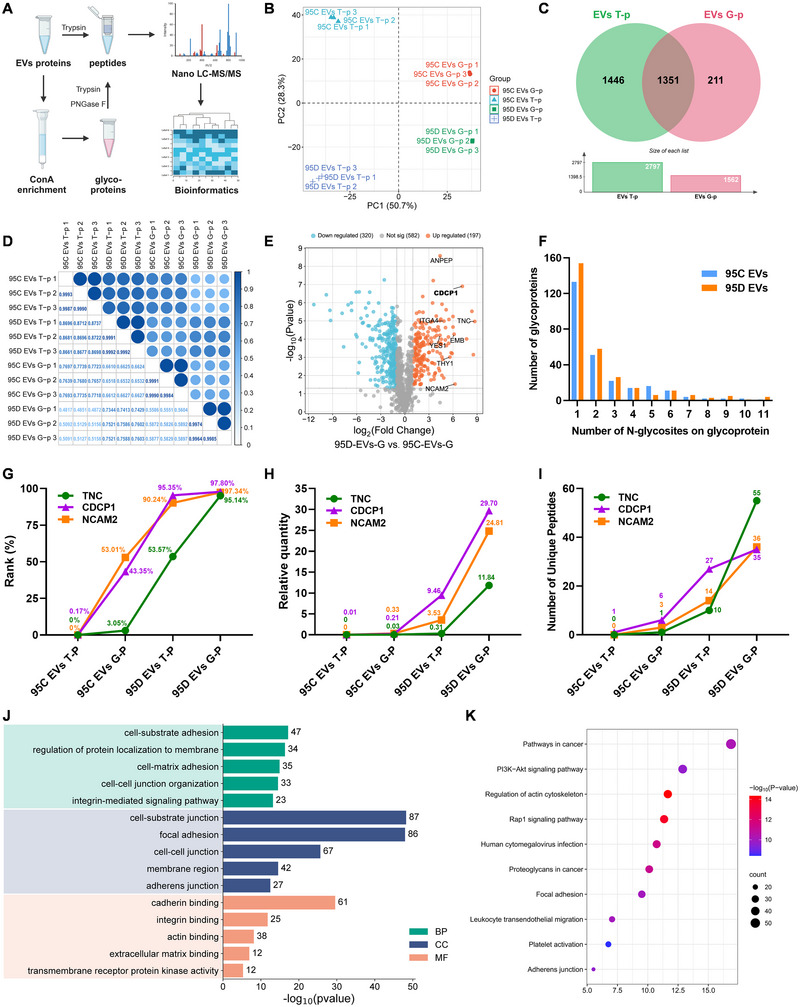
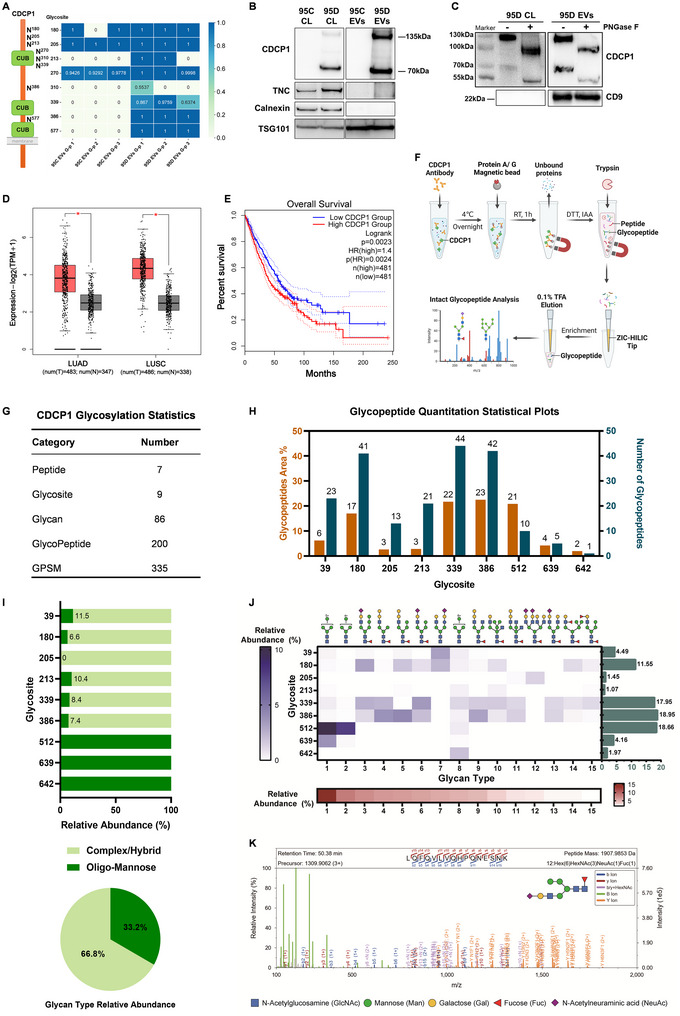
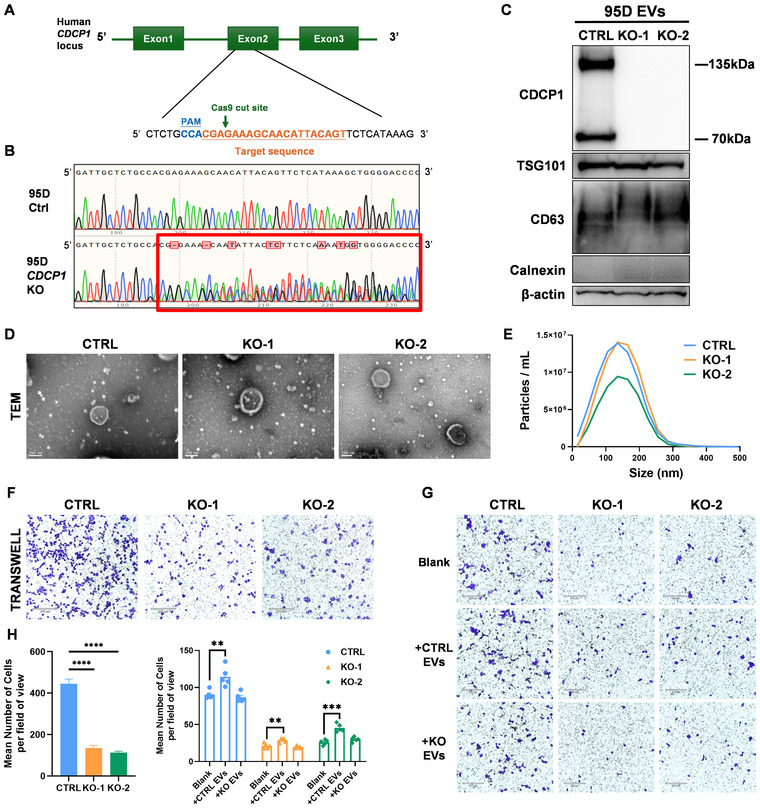
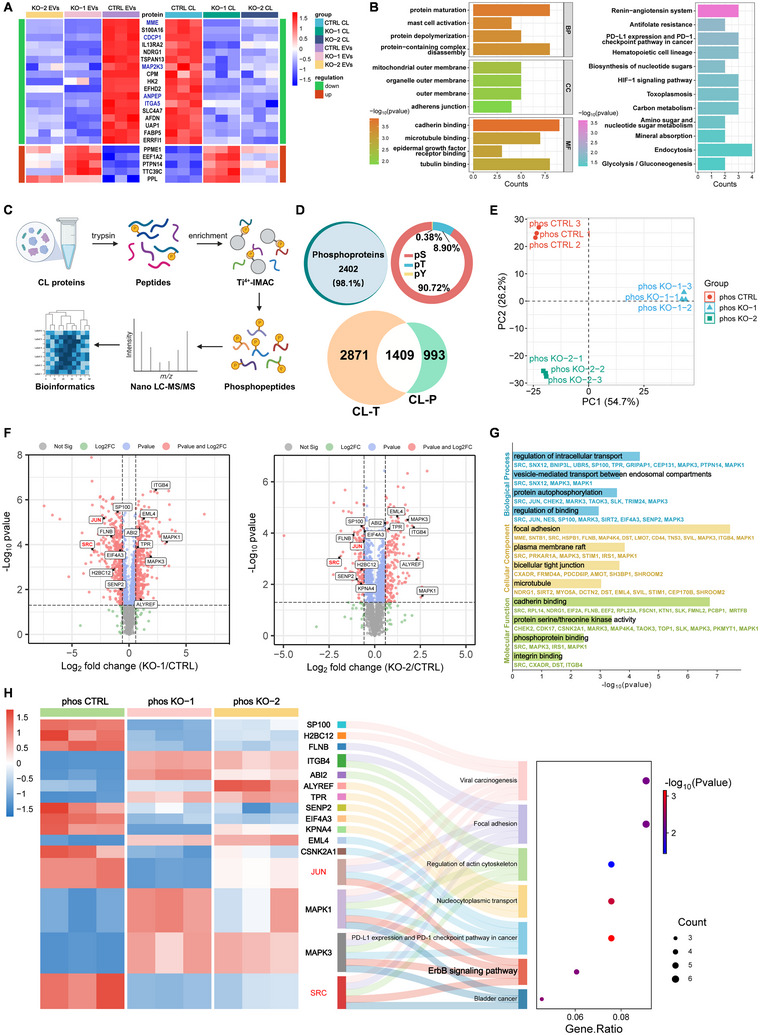
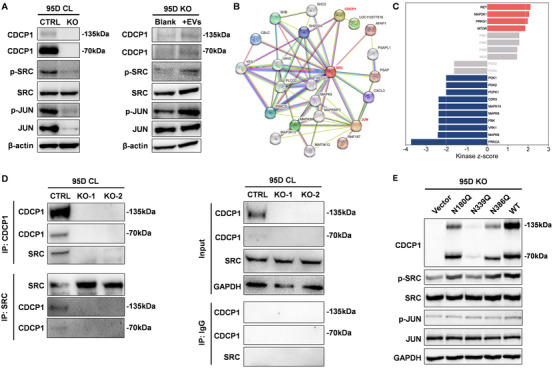
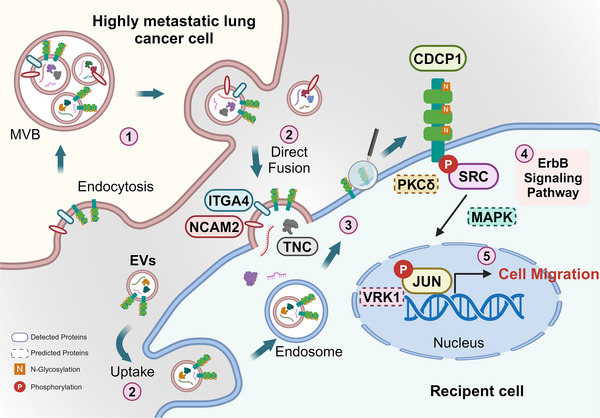
Lung cancer is the most prevalent malignancy worldwide, with the majority of fatalities attributed to metastasis. Recent studies have demonstrated the pivotal role of extracellular vesicles (EVs) and glycoproteins in tumor progression. In this study, we compared the glycoproteome of EVs from 95C (low metastatic) and 95D (high metastatic) lung cancer cells to discover key targets in metastasis. Through coupling lectin affinity chromatography with quantitative proteomics, 1562 glycoproteins were identified. Compared to 95C EVs, 23 glycoproteins were significantly upregulated more than 20-fold in 95D EVs, including CDCP1, TNC, NCAM2, and ITGA4. CUB-domain containing protein 1 (CDCP1) was upregulated 143-fold in 95D EVs, which is significantly correlated with poor prognosis of lung cancer patients in the TCGA database. We subsequently performed site-specific glycoform profiling of CDCP1 using intact glycopeptide enrichment. Then we generated CDCP1 knockout (KO) 95D cell lines and revealed that the absence of CDCP1 reduced cell migration ability, which was also confirmed by EVs and cell co-culture experiments. We further performed Ti4+-IMAC-based phosphoproteomic analysis to investigate the changes in signaling pathways in CDCP1 KO cell lines. 147 differentially expressed phosphoproteins were revealed. Verification experiments confirmed that the levels of phosphorylated SRC and JUN proteins, markers of ErbB signaling pathway, were decreased 5.5-fold and 4.2-fold, respectively. Glycosylation site mutagenesis identified N339 and N386 as critical functional determinants of CDCP1. Collectively, our data demonstrate that glycoprotein CDCP1 was selectively packed into EVs and potentially contributed to cancer metastasis, which is a critical target for anti-metastasis research and cancer therapy.

Keywords: CDCP1; extracellular vesicles; glycoproteomics; lung cancer; metastasis.


Conflict of interest statement

The authors declare no conflicts of interest.

Figures

FIGURE 1
FIGURE 1
Workflow of the pipeline based on high (95D) and low (95C) metastatic lung cancer cell EVs glycoproteome for candidate proteins discovery. The process can be divided into four parts: The first part involves the analysis of the EVs glycoproteome analysis identifying candidate glycoproteins with comprehensive glycan structural characterization. The second part is the characterization of the candidate glycoprotein. The third part is the phosphoproteomic analysis after the knockout of the candidate protein to further identify related signaling pathways. The fourth part is the validation of glycoprotein functions through Co‐IP and glycosylation site mutagenesis.
FIGURE 2
FIGURE 2
Isolation and characterization of EVs. (A) Crystal violet staining figures and Transwell assay data for 95C and 95D cells to detect migration ability (n = 5 in each group), original magnification 100×. (B) Schematic of the ultracentrifugation‐based isolation and characterization of EVs. (C) Particle size distribution of EVs by NTA. (D) Morphology of EVs by TEM. (E) Western blot analysis of cell lysate (CL) and common markers of EVs. (*p < 0.05, **p < 0.01, ***p <0.001, ****p < 0.0001).
FIGURE 3
FIGURE 3
EVs glycoprotein enrichment and proteomic analysis. (A) Workflow for proteome identification of EV total proteins and glycoproteins. (B) Principal component analysis of 95C and 95D EVs total proteins (T‐p) and glycoproteins (G‐p). (C) Venn diagram of EVs total proteins and glycoproteins. (D) Pearson correlation coefficient matrix plot of multiple groups. The correlation coefficient was represented by a color scheme from white (negative correlation) to blue (positive correlation). (E) The volcano plot represents the quantitative analysis of N‐glycoproteins in 95D EVs versus 95C EVs. Orange represents proteins that were at least 2‐fold upregulated (p < 0.05); blue represents proteins that were at least 2‐fold downregulated (p < 0.05). (F) Distribution plot of the number of N‐glycosylation sites of 95C and 95D EVs. (G‐I) Comparison of the ranking, relative quantity, and unique peptides of three typical glycoproteins before and after ConA enrichment. GO analysis (J) and KEGG pathway enrichment (K) of differentially expressed glycoproteins in EVs. BP, biological process; CC, cellular component; MF, molecular function.
FIGURE 4
FIGURE 4
Comprehensive structural characterization of CDCP1‐specific intact glycopeptides, glycoforms, and glycosylation sites. (A) Distribution map of potential glycosylation sites on the CDCP1 glycoprotein. (B) Western blot analysis of differentially expressed glycoproteins in cell lysate (CL) and EVs. (C) Western blot analysis of CDCP1 molecular weight shift following PNGase F cleavage. (D) CDCP1 expression levels in patients with lung adenocarcinoma (LUAD) and lung squamous cell carcinoma (LUSC) compared to normal tissues. Red represents tumor tissue, and grey represents normal tissue. (E) Kaplan–Meier survival curves of lung cancer patients with high or low CDCP1 levels. (F) Workflow for enrichment of CDCP1‐specific intact glycopeptides using ZIC‐HILIC chromatography. CDCP1 immunocomplexes from 95D CL were captured using protein A/G magnetic beads. On‐bead samples underwent sequential reduction (DTT), alkylation (IAA), and tryptic digestion. Glycopeptides were enriched by ZIC‐HILIC chromatography, eluted with 0.1% TFA, and analyzed via LC‐MS/MS. (G) CDCP1 glycosylation statistics table. (H) Quantitative analysis of glycopeptides. The x‐axis denotes the glycosylation sites, while the left y‐axis (yellow) represents the relative abundance of glycopeptides (glycopeptide area%), and the right y‐axis (green) indicates the number of unique glycopeptides per site. (I) Statistical analysis of categorizing N‐linked glycans. (J) Relative abundance and site‐specific distribution of the top 15 glycans. The green bar chart (right) represents the summed abundance of all glycoforms at this glycosylation site. (K) Characteristic m/z abundance profile with high‐intensity signals. Blue: b ions of peptide; red: y ions of peptide; purple: b/y ions with HexNAc residue; green: B ions; orange: Y ions of glycan with intact peptide backbone attached.
FIGURE 5
FIGURE 5
Generation and validation of CDCP1 protein knockout in 95D cells. (A) Gene targeting strategy for generating CDCP1 knockout cells. (B) DNA sequence analysis revealed the presence of the CDCP1 frameshift mutation in 95D cells. (C) Western blot analysis confirmed the knockout effect of CDCP1 protein in 95D EVs. (D) Morphology of 95D CTRL and knockout (KO) EVs by TEM. (E) Particle size distribution of 95D CTRL and KO EVs by NTA. (F) Crystal violet staining figures and Transwell assay data for 95D CTRL and KO cells to detect migration ability (n = 5 in each group), original magnification 100×. (G) Transwell figures of cell co‐culture with EVs for 24 h (n = 5 in each group), original magnification 100×. (H) Statistical analysis of migrated cells.
FIGURE 6
FIGURE 6
Effects of CDCP1 knockout on the phosphorylated proteins. (A) The heatmap shows the expression pattern of differentially expressed proteins in EVs and cell lysate (CL). The colors from blue to red indicate the increasing levels of proteins. (B) GO analysis and KEGG pathway enrichment of differentially expressed proteins in cell lysate. BP, biological process; CC, cellular component; MF, molecular function. (C) Schematic representation of phosphopeptides enrichment by Ti4+‐IMAC beads and LC‐MS/MS analysis. (D) Venn diagrams showing the specificity of phosphorylated proteins isolated by Ti4+‐IMAC, the proportion of phosphoserine (pS), phosphothreonine (pT), and phosphotyrosine (pY) in phosphosites and proteins between cell lysate total (CL‐T) and cell lysate phosphorylated (CL‐P) proteins. (E) Principal component analysis of 95D CDCP1 control (CTRL) and knockout (KO) phosphoproteins. Three replicates per group. (F) The volcano plot represents the quantitative analysis of 95D CDCP1 KO1/2 versus CTRL phosphoproteins. Red indicates changes with a fold change of at least 1.5 (p < 0.05). Values below zero on the x‐axis indicate downregulation of proteins, while values above zero indicate upregulation. (G) GO analysis of differentially expressed phosphoproteins in cell lysate. (H) Heatmap of hierarchical clustering and functional enrichment analysis of differentially expressed phosphoproteins in CDCP1‐depleted 95D cells.
FIGURE 7
FIGURE 7
Validation of the effects of CDCP1 on downstream pathways and the functions of glycosylation sites. (A) Western blot analysis showing the differentially expressed proteins in 95D CDCP1 KO cells and the changes of phosphoproteins after co‐culture of 95D CDCP1 KO cells with EVs containing CDCP1 protein. (B) Protein–protein interaction network based on STRING database. (C) Bar graph of KSEA analysis results, where red bars represent upregulated kinases and blue bars represent downregulated kinases in 95D CDCP1 KO cells. Grey bars represent kinases with no difference (p > 0.05). (D) Co‐immunoprecipitation of CDCP1 and SRC with western blot detection. IgG was used as isotype control. (E) Western blot analysis of glycosylation site mutant and wild type CDCP1 plasmid expression in CDCP1 KO 95D cells. Cell lysates were collected 48 h after transfection of cells with an equal amount of plasmid. Vector: empty vector control plasmid for transfection; WT: wild type CDCP1 expression plasmid.
FIGURE 8
FIGURE 8
Schematic illustration of how highly metastatic lung cancer cells enhance recipient cell migration via EVs carrying CDCP1 and other proteins. (1) The plasma membrane endocytoses, encapsulating specific proteins from the Golgi apparatus into intraluminal vesicles to form multivesicular bodies (MVB). MVB then fuse with the plasma membrane to release extracellular vesicles (EVs). (2) Recipient cells uptake the EVs through various mechanisms. The figure illustrates direct fusion of EVs with the plasma membrane and internalization by endocytosis, forming an endosome inside the recipient cells. (3) The contents and membrane proteins of the EVs are released and exert their functions within the recipient cells. (4) The membrane glycoprotein CDCP1 modulates the ErbB signaling pathway by regulating the phosphorylation levels of SRC. (5) The pathway affects the phosphorylation levels of the downstream JUN, which influences the transcription of migration‐related genes and promotes cell migration. Proteins with solid‐line boxes have been verified by Western blot or mass spectrometry. Those with dashed‐line boxes were identified from database predictions. “N” indicates N‐glycosylation modifications, and “P” indicates phosphorylation modifications.

Similar articles

References

    1. Attwood, M. M. , Fabbro D., Sokolov A. V., Knapp S., and Schiöth H. B.. 2021. “Trends in Kinase Drug Discovery: Targets, Indications and Inhibitor Design.” Nature Reviews. Drug discovery 20, no. 11: 839–861. - PubMed
    1. Bagdonaite, I. , Malaker S. A., Polasky D. A., et al. 2022. “Glycoproteomics.” Nature Reviews Methods Primers 2, no. 1: 48.
    1. Becker, A. , , Thakur B. K., Weiss J. M., Kim H. S., Peinado H., and Lyden D.. 2016. “Extracellular Vesicles in Cancer: Cell‐to‐Cell Mediators of Metastasis.” Cancer Cell 30, no. 6: 836–848. - PMC - PubMed
    1. Benes, C. H. , Poulogiannis G., Cantley L. C., and Soltoff S. P.. 2012. “The SRC‐associated Protein CUB Domain‐Containing Protein‐1 Regulates Adhesion and Motility.” Oncogene 31, no. 5: 653–663. - PMC - PubMed
    1. Bilbrough, T. , Piemontese E., and Seitz O.. 2022. “Dissecting the Role of Protein Phosphorylation: A Chemical Biology Toolbox.” Chemical Society Reviews 51, no. 13: 5691–5730. - PubMed

MeSH terms