. 2025 Aug 19;99(8):e0074725.
doi: 10.1128/jvi.00747-25. Epub 2025 Jul 22.

Glucocorticoid receptor occupancy of key bovine alphaherpesvirus 1 (BoHV-1) promoters correlates with chromatin remodeling during reactivation from latency

Affiliations

Glucocorticoid receptor occupancy of key bovine alphaherpesvirus 1 (BoHV-1) promoters correlates with chromatin remodeling during reactivation from latency

Jeffery B Ostler et al. J Virol. .

Abstract

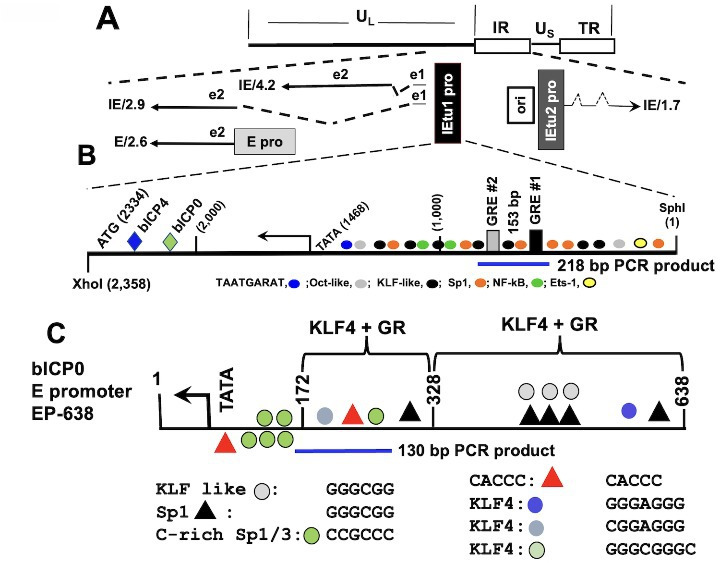
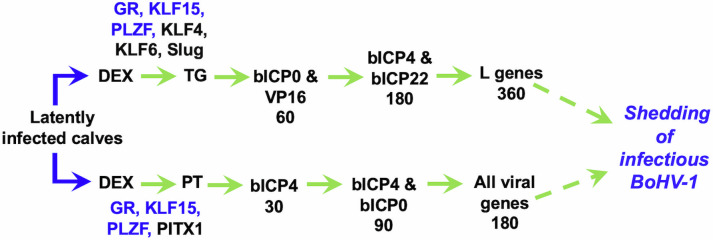
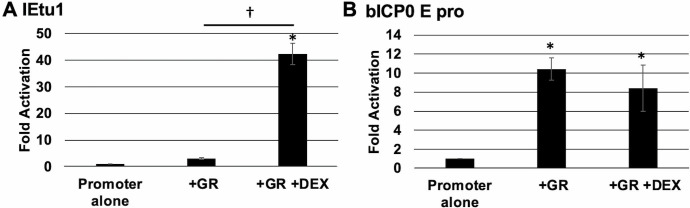
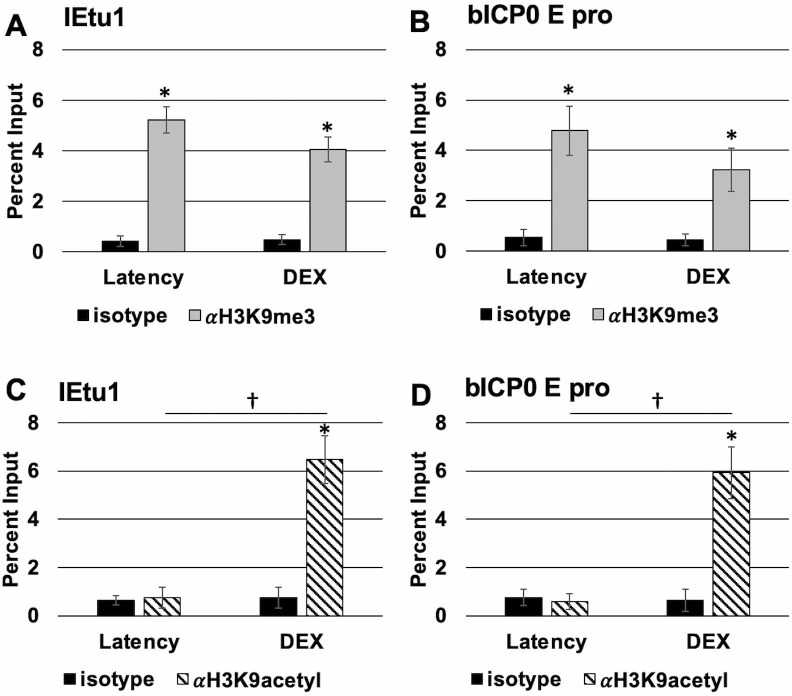
Bovine alphaherpesvirus 1 (BoHV-1) continues to be a significant bovine pathogen. Acute infections culminate in lifelong latent infections in sensory neurons of trigeminal ganglia (TG) and the central nervous system. The synthetic corticosteroid dexamethasone consistently initiates BoHV-1 reactivation from latency in calves or rabbits. The immediate early transcription unit 1 (IEtu1) promoter contains two glucocorticoid receptor (GR) response elements and drives the expression of infected cell protein 0 (bICP0) and bICP4. GR, Krüppel-like Factor 15 (KLF15), and dexamethasone treatment cooperatively transactivate the IEtu1 promoter. Conversely, the bICP0 early (E) promoter is cooperatively transactivated by two pioneer transcription factors, GR and KLF4, that are capable of binding silent heterochromatin and activating transcription. Consequently, we hypothesized that GR activates IEtu1 and bICP0 E promoters, which trigger productive infection and reactivation from latency. Notably, BoHV-1 does not replicate in GR null monkey kidney cells (COS-7), unless a GR expression plasmid is transfected with the BoHV-1 genome. Furthermore, GR occupancy of IEtu1 and bICP0 E promoters correlates with viral replication in COS-7 cells. In TG of latently infected calves, IEtu1 and bICP0 E promoters were occupied by a heterochromatin marker H3K9me3 (histone 3 trimethylation at lysine 9), but not GR. Following dexamethasone treatment of latently infected calves for 3 hours, IEtu1 and bICP0 E promoters were occupied by GR and histone 3 acetylated at lysine 9, which correlates with active transcription. Collectively, these studies provide new insights into the mechanism by which stress triggers bICP0 and bICP4 protein expression during reactivation from latency.

Importance: Bovine alphaherpesvirus 1 (BoHV-1), a significant pathogen, establishes life-long latency in certain neurons. Dexamethasone, a synthetic corticosteroid, consistently induces BoHV-1 reactivation from latency. Glucocorticoid receptor (GR) and dexamethasone transactivate the immediate early transcription unit 1 (IEtu1) promoter, which drives expression of infected cell protein 0 (bICP0) and bICP4. GR also transactivates the bICP0 early (E) promoter via a ligand-independent manner. Notably, GR and DEX induced BoHV-1 replication in non-permissive COS-7 cells. Furthermore, GR and a histone 3 marker, H3K9 acetylation, are associated with active chromatin and occupy the IEtu1 and bICP0 E promoters when latently infected calves are treated with dexamethasone for 3 hours. Conversely, a heterochromatin marker, histone 3 trimethylated at lysine 9, but not GR, occupied these viral promoters during latency. These studies revealed that GR and dexamethasone play crucial roles in chromatin remodeling of IEtu1 and bICP0 E promoters, which correlate with viral replication and reactivation from latency.

Keywords: bovine herpesvirus 1 (BoHV-1); chromatin remodeling; glucocorticoid receptor; reactivation from latency.


Conflict of interest statement

The authors declare no conflict of interest.

Figures

Fig 1
Fig 1
Schematic of the BoHV-1 genome and IEtu1. Panel A: BoHV-1 genome and location of the unique long (UL) region, direct repeats (open rectangles), and unique short region (US). IE/4.2 mRNA encodes the bICP4 protein, and IE/2.9 mRNA encodes the bICP0 protein. An IE promoter activates the expression of IE/4.2 and IE/2.9 and is designated IEtu1 (black rectangle) (7, 8). E/2.6 is the early bICP0 mRNA, and its expression is driven by the bICP0 E promoter (E pro; gray rectangle). bICP0 protein coding sequences are in Exon 2 (E2). An origin of replication (ORI) separates IEtu1 from IEtu2. IEtu2 promoter (IEtu2 pro) drives IE1.7 mRNA expression, which is translated into the bICP22 protein. Solid lines in IE/2.9, IE/4.2, and IE/1.7 are exons (e1, e2, or e3), and dashed lines are introns. Panel B: Full-length IEtu1 promoter showing the start site of transcription (arrow), TATA box, binding site for VP16/Oct1 complex (TAATGARAT), and location of GRE#1 plus GRE#2. Additional transcription factor-binding sites in the IEtu1 promoter are denoted. ETs-1 belongs to the ETS (erythroblast transformation-specific) transcription factor family. The alternative bICP4 (blue triangle) and bICP0 mRNA start sites are upstream of the initiating methionine. Numbers in parenthesis are relative to the 5’ nucleotide of the Sph1 restriction site, which is denoted as 1. Location of the 218 bp PCR product is denoted by the blue line, and primers are described in the Materials and Methods section. Panel C: the bICP0 E promoter 638 fragment. The position of the TATA box is shown with an arrow to denote the transcription start site. The positions of putative transcription factor binding sites are shown. The location of the 130 bp PCR product is denoted by a blue line, and primers are described in the Materials and Methods section.
Fig 2
Fig 2
Summary of viral genes and stress-induced cellular transcription factors during reactivation from latency in TG versus pharyngeal tonsil. Time (minutes) denotes when viral RNA is detected in pharyngeal tonsil and viral proteins detected in TG after DEX treatment of latently infected calves. Stress-induced transcription factors in pharyngeal tonsil and TG are blue, and those in black are unique to TG.
Fig 3
Fig 3
Examination of promoter activity in COS-7 cells. COS-7 cells were cultured in MEM containing 2% charcoal-stripped FBS and transfected with pGL3-promoter constructs containing either IEtu1 (Panel A) or bICP0 E pro (Panel B) promoter sequences cloned upstream of the luciferase gene expression. A plasmid expressing Renilla luciferase was cotransfected as a transfection control. Indicated samples were cotransfected with a GR expression plasmid. At 24 hours post-transcription, designated samples were treated with DEX (10 uM). At 48 hours post-transfection, samples were harvested and processed using a Promega dual-luciferase assay kit. Each sample represents the average of three biological replicates, with error bars denoting the standard deviation. Data are presented as fold activation of the indicated sample relative to the promoter construct alone. An asterisk (*) denotes a statistically significant (P < 0.01) activation relative to the promoter alone. A statistically significant (P < 0.01) difference in promoter activation between two samples is indicated by a dagger (†) over a line connecting the two designated samples. Unless indicated, differences between samples are not significant. Statistical significance was determined by Student’s t-test.
Fig 4
Fig 4
GR occupies the IEtu1 and bICP0 E promoters in transfected COS-7 cells. COS-7 cells were cultured in MEM containing 2% charcoal-stripped FBS and transfected with BoHV-1 genomic DNA. Indicated samples were co-transfected with the GR-α expression plasmid. Empty vector plasmid was added to samples as needed to maintain an equal quantity of DNA across samples. At 24 hours post-transfection, the medium was replaced, and designated samples were treated with 10 uM DEX. At 48 hours post-transfection, cells were formaldehyde-crosslinked to form DNA-protein complexes and harvested for ChIP, as described in the Materials and Methods section. Precipitated DNA was purified and amplified via PCR using the IEtu1 (Panel A) or bICP0 E pro (Panel B) primer sets. PCR products were separated on an agarose gel containing ethidium bromide with bands visualized on a Biorad Chemidoc MP and analyzed using Biorad ImageLab software. The input sample represents 13.3% of the initial total unprocessed lysate, and data for each sample are presented as a percentage of DNA recovered by immunoprecipitation using either the nonspecific isotype IgG or the indicated antibody to the input sample. Each sample represents the average of three biological replicates, with error bars denoting the standard deviation. A statistically significant (P < 0.01) enrichment of DNA recovered using the specific antibody relative to isotype is indicated by an asterisk (*). A statistically significant (P < 0.01) difference in DNA recovered between two samples is indicated by a dagger (†) over a line connecting the two designated samples. Panel C. Following transfection of COS-7 cells with BoHV-1 DNA, or GR-α expression plasmid or GR-α and DEX, cultures were incubated for 5 days. Media and cells were harvested to determine infectious virus production. Samples were frozen at −80o C and subjected to freeze-thaw (37o to −80°C) for three times. Following the final thawing, infectious virus was identified and measured by titer on MDBK cells. The virus titer is presented as plaque-forming units (pfu) per mL of media. Each sample represents the average of three biological replicates, with error bars denoting the standard deviation. An asterisk (*) denotes a statistically significant (P < 0.01) virus titer relative to BoHV-1 DNA alone. A statistically significant (P < 0.01) difference in virus titer between two samples is indicated by a dagger (†) over a line connecting the two designated samples. Statistical significance was determined by Student’s t-test.
Fig 5
Fig 5
BoHV-1 chromatin modifications in COS-7 cells. COS-7 cells were cultured in MEM containing 2% charcoal-stripped FBS and transfected with BoHV-1 genomic DNA. Indicated samples were cotransfected with a GR-α expression plasmid. The empty vector plasmid was added to samples as needed to maintain an equal quantity of DNA across samples. At 24 hours post-transfection, the medium was replaced, and designated samples were treated with 10 uM DEX in MEM containing 2% FBS. At 48 hours post-transfection, cells were formaldehyde-crosslinked to form DNA-protein complexes and harvested for ChIP. Precipitated DNA was purified and amplified via PCR using the IEtu1 (Panels A & C) or bICP0 E pro (Panels B & D) primer sets. PCR products were separated on an agarose gel containing ethidium bromide with bands visualized on a Biorad Chemidoc MP and analyzed using Biorad ImageLab software. The input sample represents 13.3% of the initial total unprocessed lysate, and data for each sample are presented as a percentage of DNA recovered by immunoprecipitation using either the nonspecific isotype IgG or the indicated antibody relative to the input sample. Each sample represents the average of three biological replicates, with error bars denoting the standard deviation. A statistically significant (P < 0.01) enrichment of DNA recovered using the specific antibody relative to isotype is indicated by an asterisk (*). A statistically significant (P < 0.01) difference in DNA recovered between two samples is indicated by a dagger (†) over a line connecting the two designated samples. Statistical significance was determined by Student’s t-test.
Fig 6
Fig 6
GR occupancy with the BoHV-1 genome during reactivation in calves. TG from a BoHV-1 latently infected calf or latently infected calf treated with DEX for 3 hours was harvested as described in the Materials and Methods section and stored at −80℃. Individual 300 mg samples were finely sliced over dry ice to maintain frozen tissue and formaldehyde-crosslinked to create DNA-protein complexes. The fixed tissue was homogenized by grinding into a fine powder using a liquid nitrogen-cooled mortar and pestle. This powder was suspended in passive lysis buffer and sonicated to produce ~500 nt DNA fragments. Each sample was centrifuged to remove the substantial tissue debris, and the supernatant was collected for processing by ChIP, as described in the Materials and Methods section. Precipitated DNA was purified and amplified via PCR using the IEtu1 (Panel A) or bICP0 E pro (Panel B) primer sets. PCR products were separated on an agarose gel containing ethidium bromide with bands visualized on a Biorad Chemidoc MP and analyzed using Biorad ImageLab software. The input sample represents 13.3% of the initial total unprocessed lysate, and data for each sample are presented as a percentage of DNA recovered by immunoprecipitation using either the nonspecific isotype IgG or the indicated antibody relative to the input sample. Each condition represents the average of three samples taken from TG of a calf, with error bars denoting the standard deviation. A statistically significant (P < 0.01) enrichment of DNA recovered using the specific antibody relative to isotype is indicated by an asterisk (*). A statistically significant (P < 0.01) difference in DNA recovered from TG of latently infected calves or latently infected calves treated with DEX for 3 hours is indicated by a dagger (†). Statistical significance was determined by Student’s t-test.
Fig 7
Fig 7
Chromatin modifications in the BoHV-1 genome during reactivation in calves. TG from a BoHV-1 latently infected calf or a latently infected calf treated with DEX for 3 hours was collected as described in the Materials and Methods section and stored at −80°C. Individual 300 mg samples were finely sliced over dry ice to prevent thawing of the tissue and formaldehyde-crosslinked to create DNA-protein complexes. The fixed tissue was homogenized by grinding into a fine powder using a liquid nitrogen-cooled mortar and pestle. The powder was suspended in passive lysis buffer and sonicated to produce ~500 nt DNA fragments. Each sample was centrifuged to remove the substantial tissue debris, and the supernatant was collected for processing by ChIP, as described in the Materials and Methods section. Precipitated DNA was purified and amplified via PCR using the IEtu1 (Panels A and C) or bICP0 E pro (Panels B and D) primer sets. The PCR product was separated on an agarose gel containing ethidium bromide with bands visualized on a Biorad Chemidoc MP and analyzed using Biorad ImageLab software. Input samples represent 13.3% of the initial total unprocessed lysate, and data for each sample are presented as a percentage of DNA recovered by immunoprecipitation using either the nonspecific isotype IgG or the indicated antibody relative to the input sample. Each condition represents the average of three samples taken from TG of a calf, with error bars denoting the standard deviation. A statistically significant (P < 0.01) enrichment of DNA recovered using the specific antibody relative to isotype is indicated by an asterisk (*). A statistically significant (P < 0.01) difference in DNA recovered from TG of latently infected calves or latently infected calves treated with DEX for 3 hours is indicated by a dagger (†). Statistical significance was determined by Student’s t-test.

Similar articles

References

    1. Ostler JB, Jones C. 2023. The bovine herpesvirus 1 latency-reactivation cycle, a chronic problem in the cattle industry. Viruses 15:552. doi: 10.3390/v15020552 - DOI - PMC - PubMed
    1. Highlander SK. 2001. Molecular genetic analysis of virulence in Mannheimia (pasteurella) haemolytica. Front Biosci 6:D1128–50. doi: 10.2741/highland - DOI - PubMed
    1. Jones C. 2019. Bovine herpesvirus 1 counteracts immune responses and immune-surveillance to enhance pathogenesis and virus transmission. Front Immunol 10:1008. doi: 10.3389/fimmu.2019.01008 - DOI - PMC - PubMed
    1. Yates WD, Babiuk LA, Jericho KW. 1983. Viral-bacterial pneumonia in calves: duration of the interaction between bovine herpesvirus 1 and Pasteurella haemolytica. Can J Comp Med 47:257–264. - PMC - PubMed
    1. Yates WDG. 1982. There is no DOI number. There is a PMCID number: PMC1320319. A review of infectious bovine rhinotracheitis, shipping fever pneumonia and viral-bacterial synergism in respiratory disease of cattle. Can J Comp Med 46:225–263. - PMC - PubMed

LinkOut - more resources