

Construction of mitochondrial signature (MS) for the prognosis of ovarian cancer
- PMID: 40694220
- PMCID: PMC12283533
- DOI: 10.1007/s12672-025-02892-7
Construction of mitochondrial signature (MS) for the prognosis of ovarian cancer
Abstract
Background: Ovarian cancer (OV) continues to be the most lethal type of gynecological cancer with a poor prognosis. During tumorigenesis and cancer advancement, mitochondria are key players in energy metabolism. This study focuses on exploring the mitochondria-related genes for the prognosis of OV.
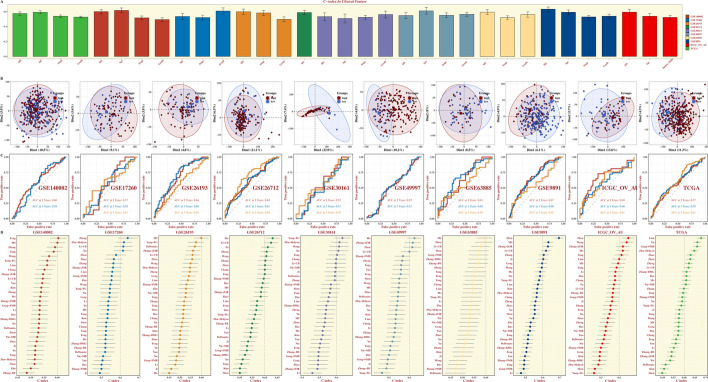
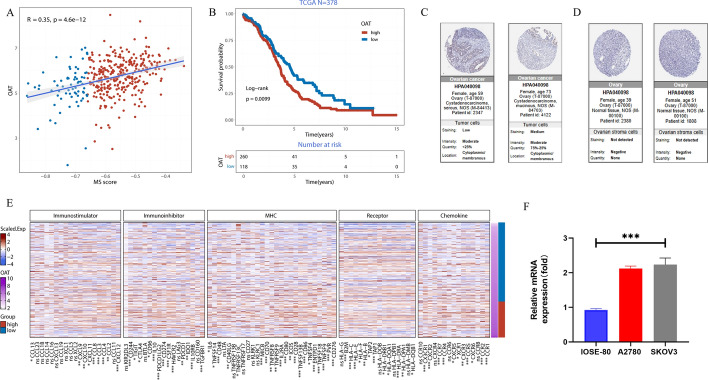
Methods: RNA expression profiles and single-cell data were acquired from The Cancer Genome Atlas (TCGA), International Cancer Genome Consortium (ICGC), and Gene Expression Omnibus databases for screening and validating mitochondria-related differentially expressed genes (DEGs). After univariate Cox analysis, prognostic genes were carried out for modeling mitochondria signature (MS) based on 101 combinations of 10 machine learning algorithms. Functional enrichment analysis was performed on this prognostic gene set. Immune infiltration analysis was performed between MS groups. Validation for the prognostic model gene OAT was performed to identify the prognostic significance, combined with in vitro experiments to explore its expressions in OV cells. qRT-PCR assay was performed to examine the expression of OAT in human ovarian cancer cell samples and normal ovarian epithelial cells.
Results: A total of 21 prognostic mitochondria-related DEGs were identified for reliably constructing the model MS with excellent prognostic performance in OV. GO and KEGG analysis confirmed these genes were enriched in the generation of precursor metabolites and energy. It illustrated more lymphocyte infiltration in the high MS group than low MS group. OAT served as a novel biomarker for OV patients, showing poor survival in OV patients with high expression of OAT. qPCR assays confirmed its significantly high expression in human ovary cancer cell lines.
Conclusions: The MS offers tailored risk evaluations and immunotherapy treatments for each OV patient. MS model gene OAT has been recognized as a new oncogene for OV linked to immune escape.
Keywords: Biomarker; Immunotherapy; Ovarian cancer; Tumor microenvironment.
© 2025. The Author(s).
Conflict of interest statement
Declarations. Ethics approval and consent to participate: Not applicable. Consent for publication: All authors agree to publish. Competing interests: The authors declare no competing interests.
Figures


Similar articles
-
Construction and validation of a lipid metabolism-related genes prognostic signature for skin cutaneous melanoma.Biochem Biophys Res Commun. 2025 Aug 15;775:152115. doi: 10.1016/j.bbrc.2025.152115. Epub 2025 May 29. Biochem Biophys Res Commun. 2025. PMID: 40460484
-
Integrative Analysis of Novel Ferroptosis-Related Genes Signatures as Prognostic Biomarkers in Ovarian Cancer.Cancer Rep (Hoboken). 2025 Aug;8(8):e70284. doi: 10.1002/cnr2.70284. Cancer Rep (Hoboken). 2025. PMID: 40744688 Free PMC article.
-
A novel copper-induced cell death-related lncRNA prognostic signature associated with immune infiltration and clinical value in gastric cancer.J Cancer Res Clin Oncol. 2023 Sep;149(12):10543-10559. doi: 10.1007/s00432-023-04916-7. Epub 2023 Jun 8. J Cancer Res Clin Oncol. 2023. PMID: 37291405 Free PMC article.
-
Cost-effectiveness of using prognostic information to select women with breast cancer for adjuvant systemic therapy.Health Technol Assess. 2006 Sep;10(34):iii-iv, ix-xi, 1-204. doi: 10.3310/hta10340. Health Technol Assess. 2006. PMID: 16959170
-
A rapid and systematic review of the clinical effectiveness and cost-effectiveness of topotecan for ovarian cancer.Health Technol Assess. 2001;5(28):1-110. doi: 10.3310/hta5280. Health Technol Assess. 2001. PMID: 11701100
References
-
- Webb PM, Jordan SJ. Global epidemiology of epithelial ovarian cancer. Nat Rev Clin Oncol. 2024;21:389–400. 10.1038/s41571-024-00881-3. - PubMed
-
- Armstrong DK, Alvarez RD, Backes FJ, et al. NCCN guidelines® insights: ovarian cancer, version 3.2022. J Natl Compr Canc Netw. 2022;20:972–80. 10.6004/jnccn.2022.0047. - PubMed
Grants and funding
LinkOut - more resources
Full Text Sources