. 2025 Dec;62(12):15654-15668.
doi: 10.1007/s12035-025-05193-w. Epub 2025 Jul 22.

G Proteins-Associated Dose-Dependent Effects of Oxytocin on Oxytocin Neuronal Activity and Astrocytic Plasticity of the Supraoptic Nucleus

Affiliations

G Proteins-Associated Dose-Dependent Effects of Oxytocin on Oxytocin Neuronal Activity and Astrocytic Plasticity of the Supraoptic Nucleus

Xiao-Yu Liu et al. Mol Neurobiol. 2025 Dec.

Abstract

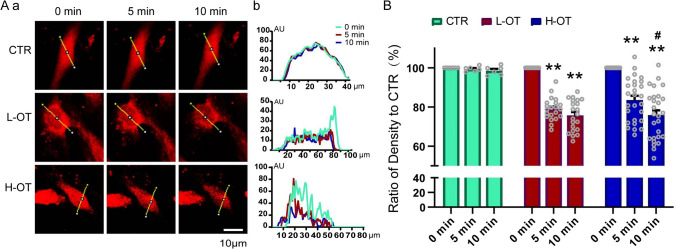
Dose-dependent neuromodulation has been well established; however, the molecular mechanisms underlying astrocytic involvement in this process remain largely unexplored. Using the autoregulation of supraoptic oxytocin (OT) neurons (OTNs) as a model, we investigated the role of distinct astrocytic G proteins and their targets in the dose-dependent effects of OT on OTN activity. The results showed that OT in a low concentration (10 pmol/L, L-OT) excited OTN activity, whereas a high concentration (1 nmol/L, H-OT) inhibited it in brain slices. These effects were abolished upon disruption of astrocytic plasticity using L-aminoadipic acid, a gliotoxin. In primary astrocyte cultures, L-OT slightly reduced the current through astrocyte-specific inwardly rectifying K⁺ channel 4.1 (Kir4.1) while H-OT strongly enhanced it. Selectively blocking Kir4.1 with BaCl₂ (100 µmol/L) did not affect the basal activity but blocked the excitatory effect of L-OT in brain slices. In cultured astrocytes, L-OT mobilized Gαq subunit expression, increased glial fibrillary acidic protein (GFAP) filaments, and quickly expanded astrocytic volume, predominantly visible at the somata. Conversely, H-OT released Gαi subunits and induced progressive volume expansion. Pretreatment of brain slices with U73122 (a Gq inhibitor) or SQ22536 (a Gs inhibitor) suppressed L-OT-induced excitation. Conversely, activation of adenylyl cyclase with forskolin reversed the inhibitory effect of H-OT, and inhibition of Gi with pertussis toxin blocked H-OT-induced inhibition. These findings imply that the dose-dependent effects of OT on OTN activity are mediated, at least partially, by different receptor-coupled G proteins and their subsequent modulation of astrocytic Kir4.1 currents, GFAP expression, and volume dynamics. This mechanism underlying the autoregulation of OTN activity provides an important reference for understanding the concentration-dependent neuromodulation.

Keywords: Excitability; G protein; Glia; Hypothalamus; Neurons; Oxytocin.


Conflict of interest statement

Declarations. Ethics Approval: This study was performed in accordance with the Guideline of National Institutes of Health and approved by the Institutional Animal Care and Use Committees of Harbin Medical University (HMU2023-03–05). Competing interests: The authors declare no competing interests.

Figures

Fig. 1
Fig. 1
Effect of different concentrations of oxytocin (OT) on the firing activity of OT neurons (OTNs) in the supraoptic nucleus (SON) in brain slices. A Representative recordings showing changes in the firing rates in OTNs after the treatments of low (L-OT, 10 pmol/L, a) and high (H-OT, 1 nmol/L, b) concentrations of OT. The inset shows an image of post hoc identified OTNs, having co-localization of OT neurophysin (OT-NP) with biocytin. B Dotted line graphs summarizing statistical analyses of the firing rate at L-OT (a) and H-OT (b) with bin width of 1 min. *P < 0.05, **P < 0.01 compared to the control (CTR, 0–1 min before OT) by paired t-test
Fig. 2
Fig. 2
Effects of l-aminoadipic acid (L-AAA) on OT-modulated electrical activity of OTNs in the SON of brain slices. A and B Representative recordings showing changes in the firing rates in OTNs (a) and line graphs showing statistical analyses (b) of L-AAA effect on L-OT (A) and H-OT (B) actions, respectively. Other annotations refer to Fig. 1
Fig. 3
Fig. 3
Effect of L-OT and H-OT on Ba2+- sensitive inwardly rectifying K+ current Kir4.1 of the primary cultures of hypothalamic astrocytes. A and B Kir4.1 currents in representative waveforms (a) and in the current–voltage curves (b) in response to L-OT (A) or H-OT (B) application for 2 min, respectively. Note that, the membrane potential of single astrocytes was held at − 70 mV with voltage steps of 20 mV increments from − 160 to + 80 mV; *P < 0.05 compared to the CTR by paired t-test. Other annotations refer to Fig. 1
Fig. 4
Fig. 4
Effects of blocking Kir4.1 on L-OT-modulated OTN firing activity in the brain slices. A Representative full recording (top panel) and expanded episodes (bottom panel) showing changes in OTN firing rate in response to L-OT in the presence of BaCl2. B Line (a) and dotted (b) graphs showing the results of statistical analysis of L-OT effects in the presence of BaCl2. Other annotations refer to Fig. 1
Fig. 5
Fig. 5
Effect of L-OT and H-OT on astrocytic volume in the primary cultures. A Representative images (a) and time-associated curves of fluorescence intensity (b) of SR101-loaded hypothalamic astrocytes, wherein the line in b represents the fluorescence density at the yellow straight line in Aa. B Bar-graphs summarizing time-dependent changes in total fluorescence intensity, and dotted graphs showing individual intensity of the cells tested. **, P < 0.01 compared to 0 min; #, P < 0.05 compared to 5 min. AU, arbitrary units
Fig. 6
Fig. 6
Effect of L-OT and H-OT on GFAP expressions in the primary cultures of hypothalamic astrocytes. A Representative imaging showing the fluorescence intensity of GFAP filaments (a) and dotted graphs summarizing the statistical analysis of OT effects (b). B Representative Western blotting bands (a) and dotted graphs showing statistical analysis of OT effects (b). *, P < 0.05 compared to the CTR; #, P < 0.05 compared to L-OT
Fig. 7
Fig. 7
Effects of L-OT and H-OT on G protein expressions and the relative spatial distribution of GFAP filaments with Gq, Gs, and Gi in the primary cultures of hypothalamic astrocytes. AC Representative fluorescence images showing the distribution of GFAP (green), Gq (A, red)/Gs(B, red)/Gi(C, red) and nuclei (blue) (a), respectively, and dotted graphs showing statistical analyses of the average intensity of Gq/Gs/Gi (left panel in b), and the ratio of GFAP co-localized with Gq/Gs/Gi proteins (right panel in b), respectively. Note that, yellow bar = 40 μm; **, P < 0.01, ***, P < 0.001 compared with CTR; ##, P < 0.01 compared with L-OT. Arrows represent the sites where the two proteins are differentially expressed
Fig. 8
Fig. 8
Effect of L-OT and H-OT on OTN firing activity after pharmacological modulation of different G protein signaling pathways in the brain slices. AD Exemplary firing activity of OTNs in patch-clamp recordings (a) and statistical analyses in line graphs (b) following the pre-incubation of U73122 (A), SQ22536 (B), forskolin (C), and pertussis toxin (PTX, D), respectively. *, P < 0.05 by paired t-test

References

    1. Carter CS, Kenkel WM, MacLean EL, Wilson SR, Perkeybile AM, Yee JR, Ferris CF, Nazarloo HP et al (2020) Is oxytocin “nature’s medicine”? Pharmacol Rev 72(4):829–861. 10.1124/pr.120.019398 - PMC - PubMed
    1. Higuchi T, Tadokoro Y, Honda K, Negoro H (1986) Detailed analysis of blood oxytocin levels during suckling and parturition in the rat. J Endocrinol 110(2):251–256 - PubMed
    1. Lincoln DW, Wakerley JB (1975) Factors governing the periodic activation of supraoptic and paraventricular neurosecretory cells during suckling in the rat. J Physiol 250(2):443–461 - PMC - PubMed
    1. Augustine RA, Seymour AJ, Campbell RE, Grattan DR, Brown CH (2018) Integrative neuro-humoral regulation of oxytocin neuron activity in pregnancy and lactation. J Neuroendocrinol. 10.1111/jne.12569 - PubMed
    1. Leng G, MacGregor DJ (2018) Models in neuroendocrinology. Math Biosci 305:29–41. 10.1016/j.mbs.2018.07.008 - PubMed

LinkOut - more resources