

Leveraging chromatin packing domains to target chemoevasion in vivo
- PMID: 40694328
- PMCID: PMC12318189
- DOI: 10.1073/pnas.2425319122
Leveraging chromatin packing domains to target chemoevasion in vivo
Abstract
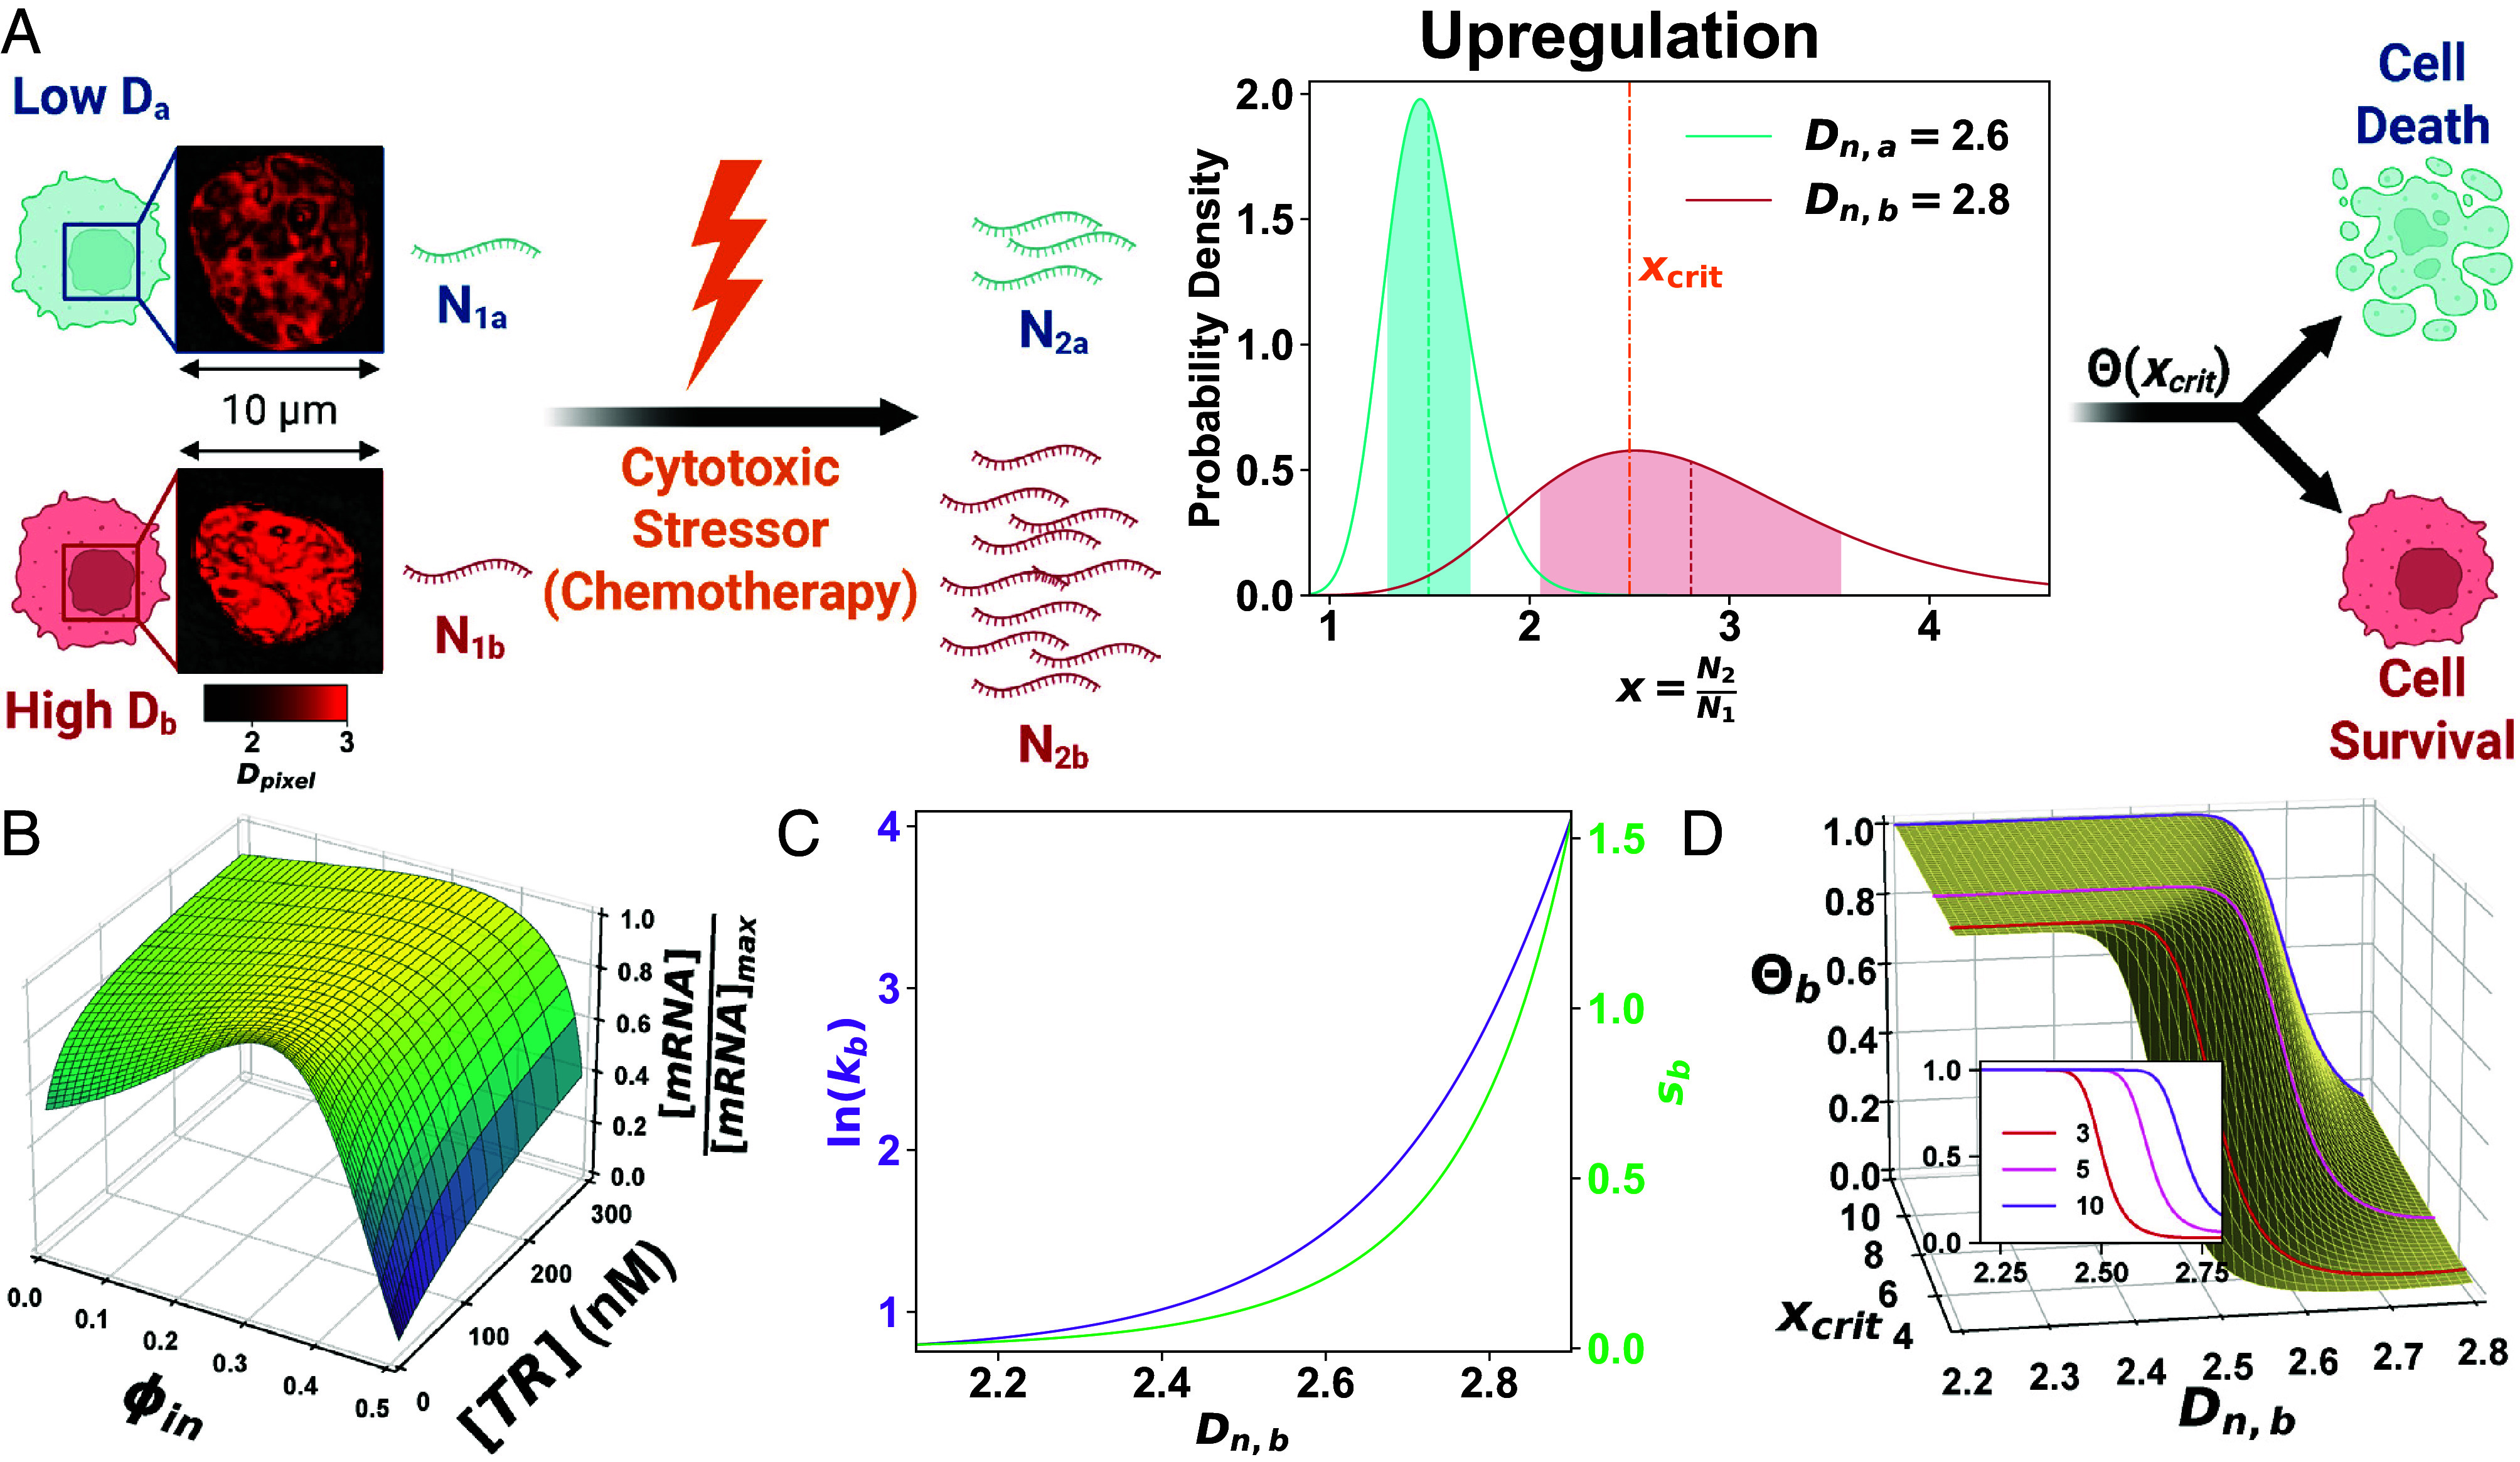
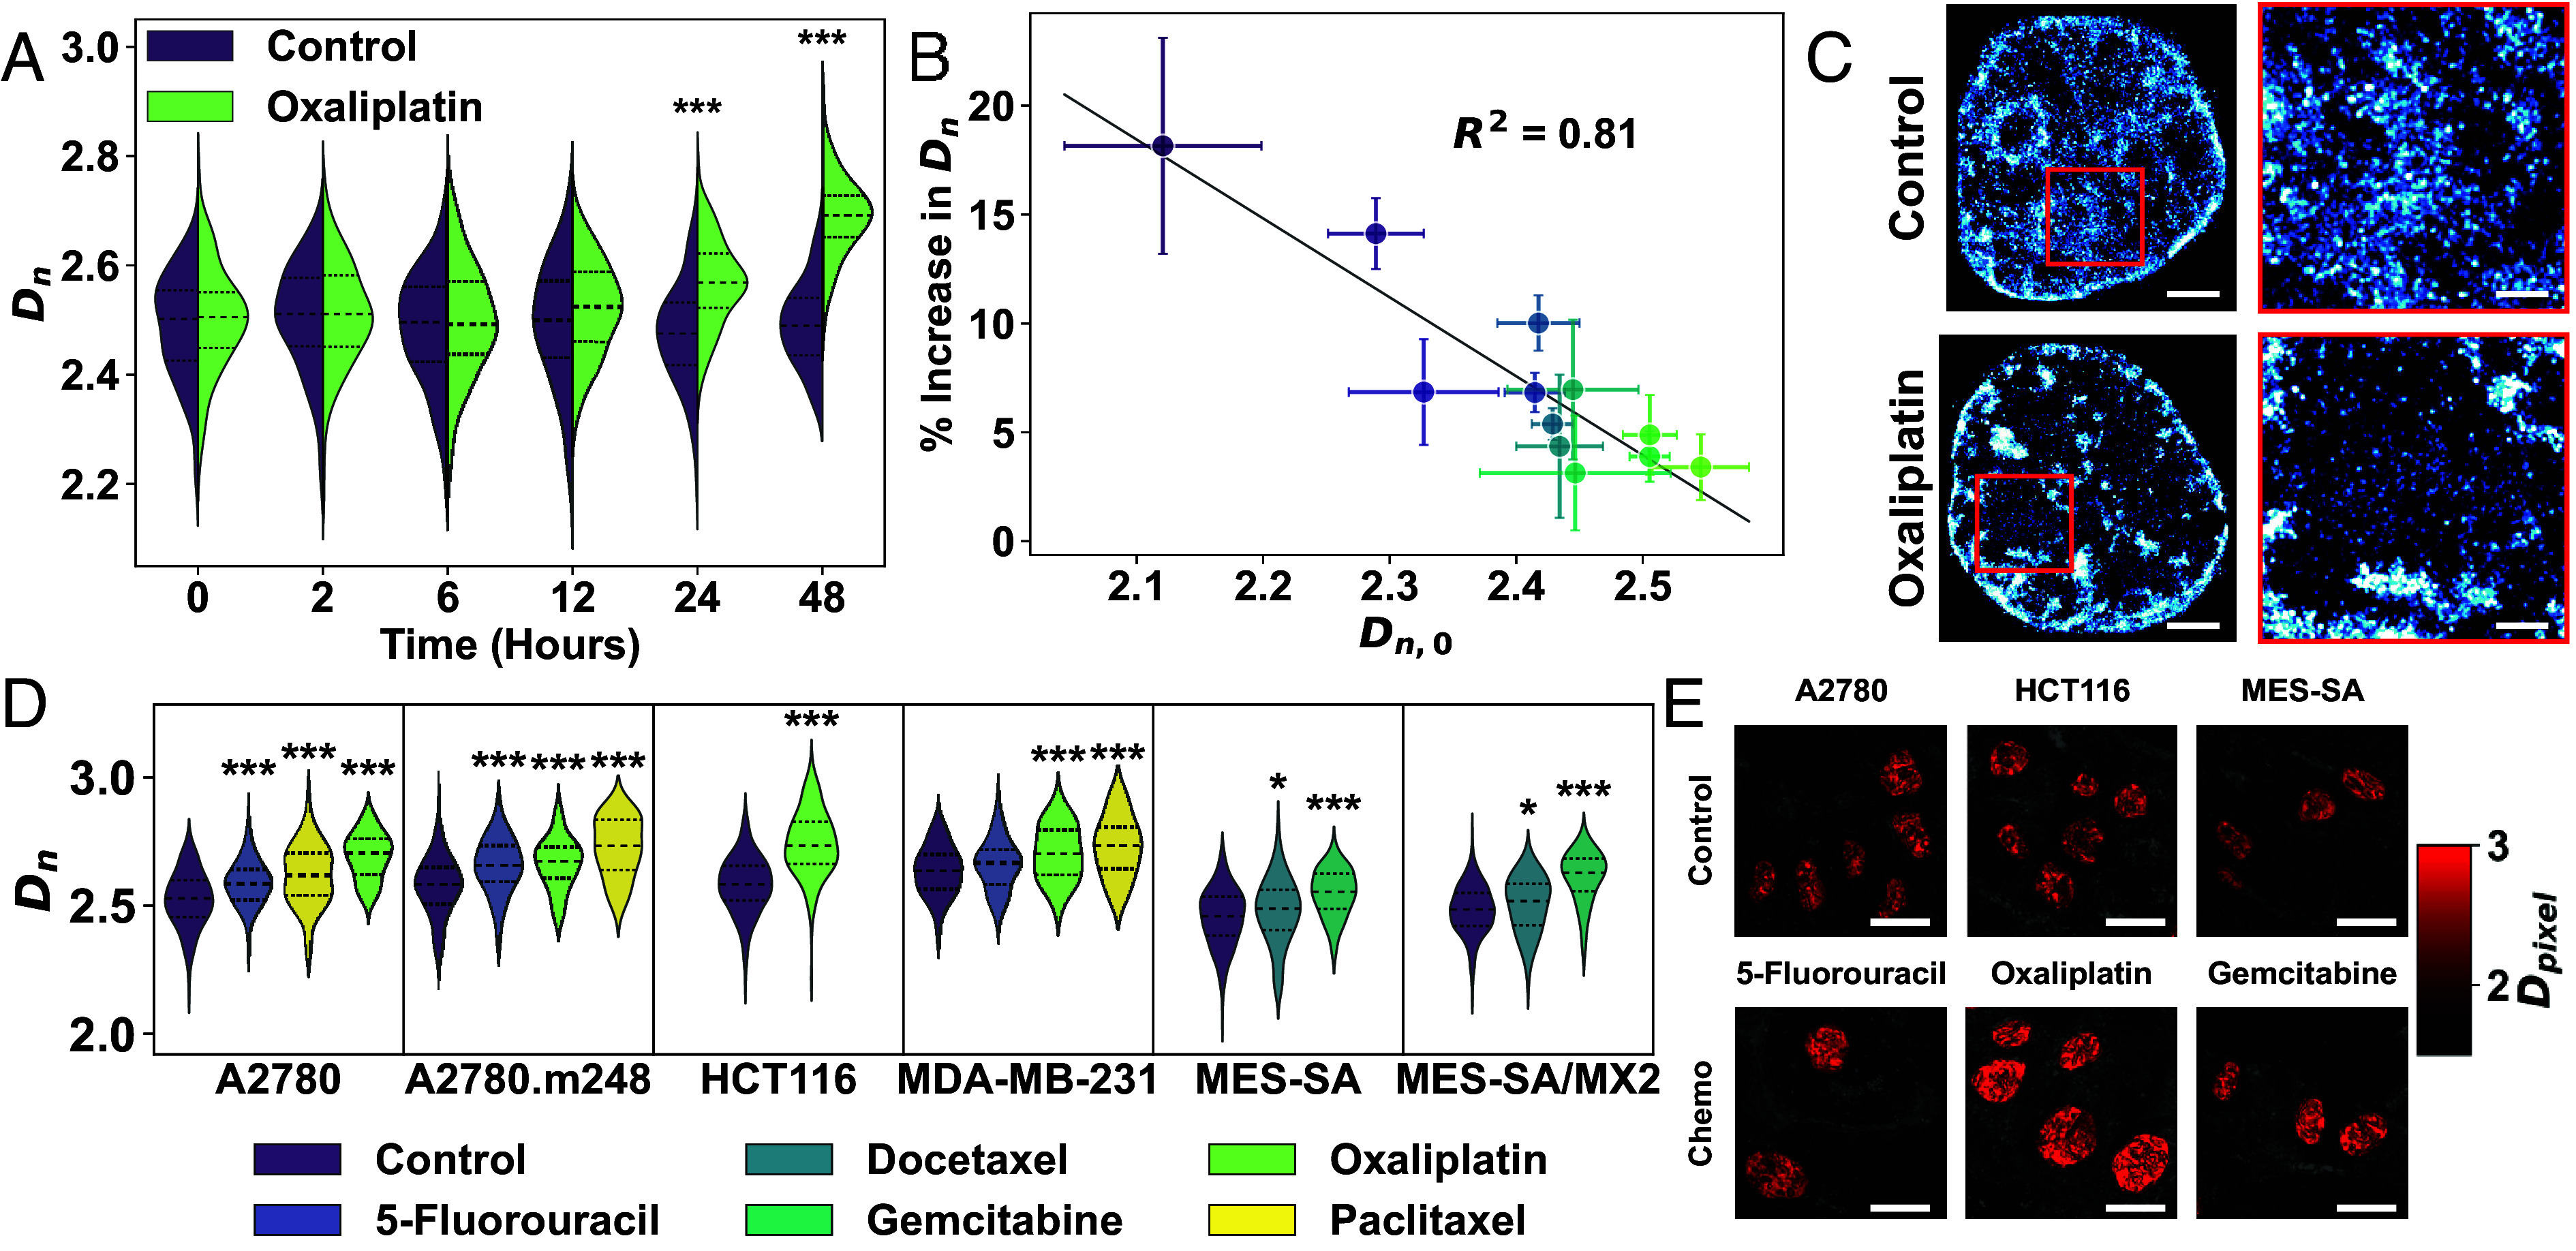
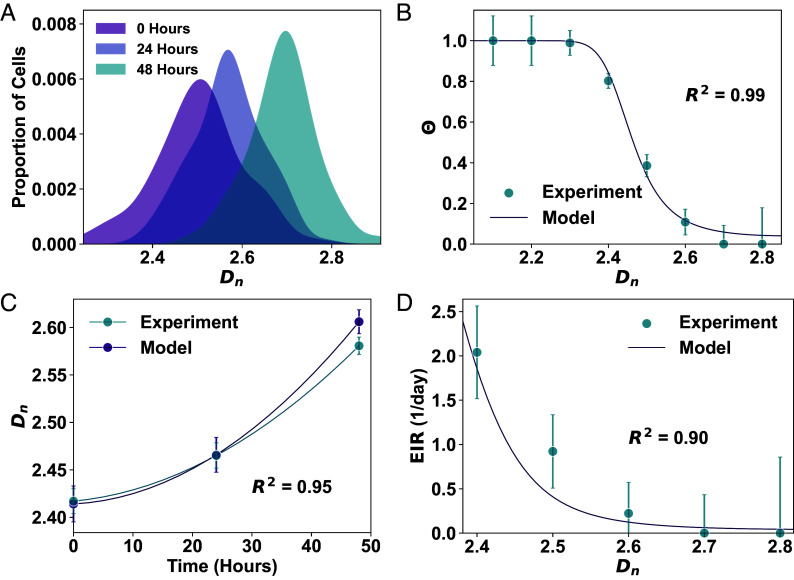
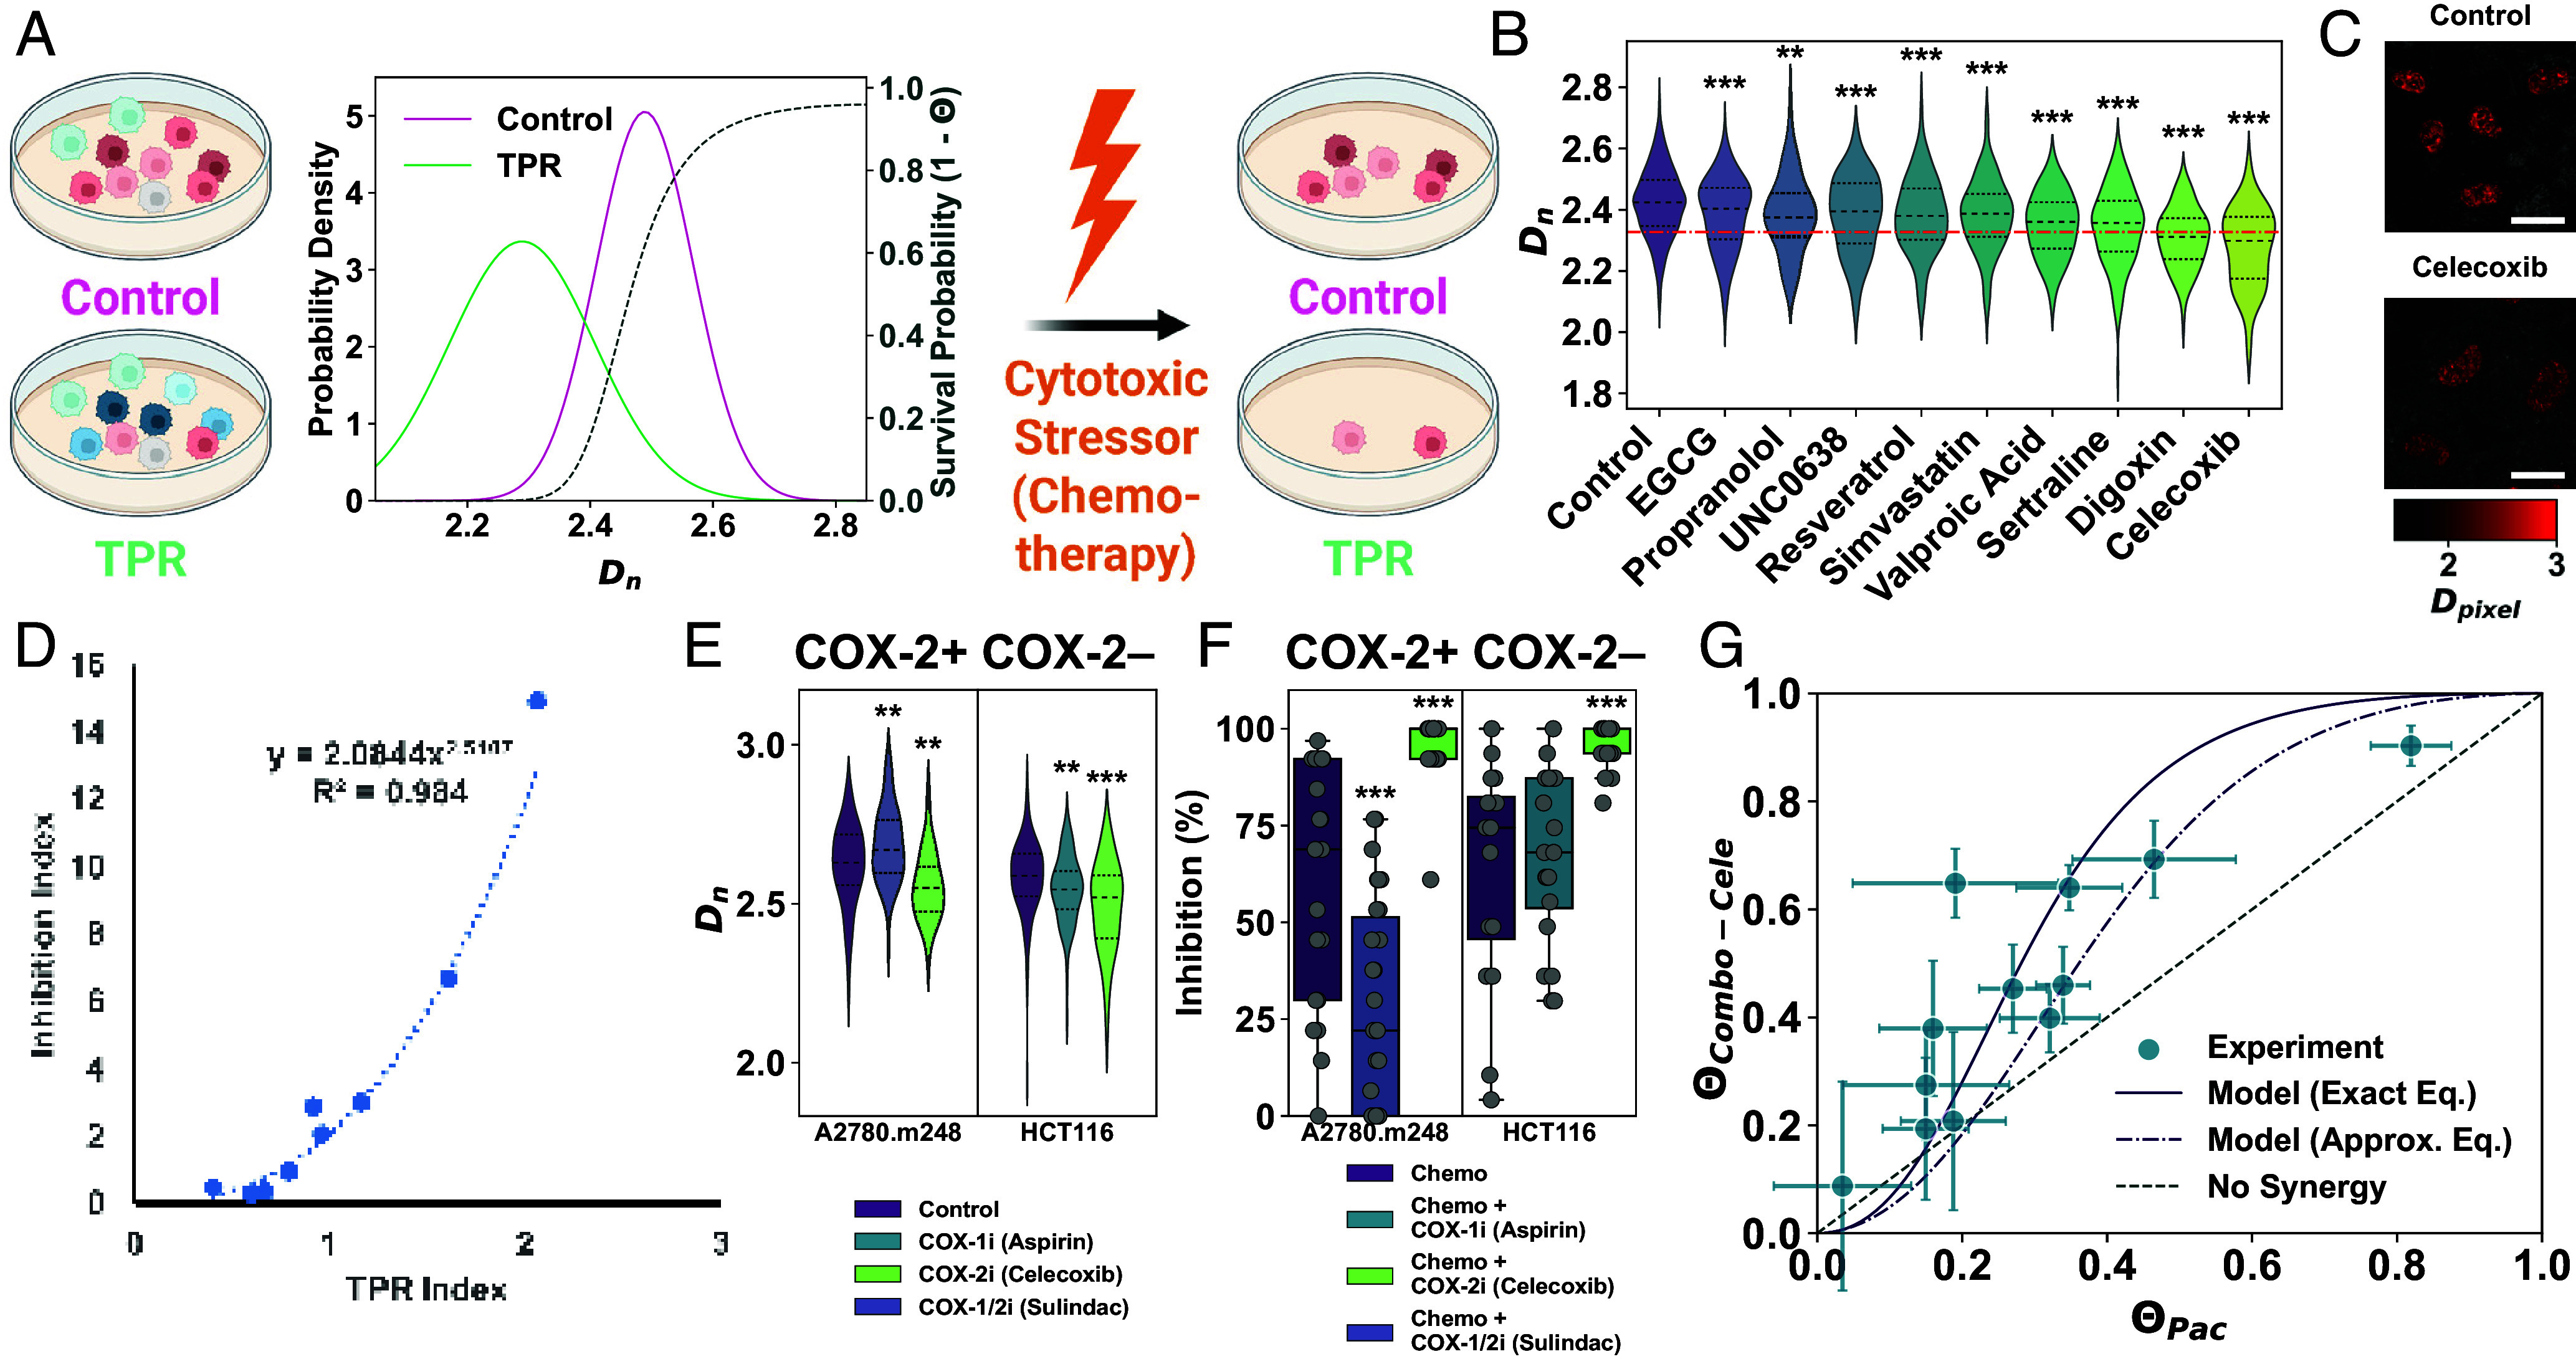
Cancer cells exhibit a remarkable resilience to cytotoxic stress, often adapting through transcriptional changes linked to alterations in chromatin structure. In several types of cancer, these adaptations involve epigenetic modifications and restructuring of topologically associating domains. However, the underlying principles by which chromatin architecture facilitates such adaptability across different cancers remain poorly understood. To investigate the role of chromatin in this process, we developed a physics-based model that connects chromatin organization to cell fate decisions, such as survival following chemotherapy. Our model builds on the observation that chromatin forms packing domains, which influence transcriptional activity through macromolecular crowding. The model accurately predicts chemoevasion in vitro, suggesting that changes in packing domains affect the likelihood of survival. Consistent results across diverse cancer types indicate that the model captures fundamental principles of chromatin-mediated adaptation, independent of the specific cancer or chemotherapy mechanisms involved. Based on these insights, we hypothesized that compounds capable of modulating packing domains, termed Transcriptional Plasticity Regulators (TPRs), could prevent cellular adaptation to chemotherapy. We conducted a proof-of-concept compound screen using live-cell chromatin imaging to identify several TPRs that synergistically enhanced chemotherapy-induced cell death. The most effective TPR significantly improved therapeutic outcomes in a patient-derived xenograft model of ovarian cancer. These findings underscore the central role of chromatin in cellular adaptation to cytotoxic stress and present a framework for enhancing cancer therapies, with broad potential across multiple cancer types.
Keywords: Biophysics; cancer; chemotherapy; chromatin; plasticity.
Conflict of interest statement
Competing interests statement:The authors declare no competing interest.
Figures
Update of
-
Leveraging chromatin packing domains to target chemoevasion in vivo.bioRxiv [Preprint]. 2024 Nov 15:2024.11.14.623612. doi: 10.1101/2024.11.14.623612. bioRxiv. 2024. Update in: Proc Natl Acad Sci U S A. 2025 Jul 29;122(30):e2425319122. doi: 10.1073/pnas.2425319122. PMID: 39605341 Free PMC article. Updated. Preprint.
References
-
- Suzuki K., Kostin S., Person V., Elsässer A., Schaper J., Time course of the apoptotic cascade and effects of caspase inhibitors in adult rat ventricular cardiomyocytes. J. Mol. Cell. Cardiol. 33, 983–994 (2001). - PubMed
MeSH terms
Substances
Grants and funding
- U54 CA261694/CA/NCI NIH HHS/United States
- Funded Lever Award/Chicago Biomedical Consortium (CBC)
- R01CA155284/HHS | NIH | National Cancer Institute (NCI)
- P30 CA060553/CA/NCI NIH HHS/United States
- R01CA228272/HHS | NIH | National Cancer Institute (NCI)
- EFMA-1830961/NSF | ENG | Division of Emerging Frontiers and Multidisciplinary Activities (EFMA)
- T32 AI083216/AI/NIAID NIH HHS/United States
- EFMA-1830968/NSF | ENG | Division of Emerging Frontiers and Multidisciplinary Activities (EFMA)
- DGE-1842165/NSF | EDU | Division of Graduate Education (DGE)
- R01CA165309/HHS | NIH | National Cancer Institute (NCI)
- CBET-1249311/NSF | ENG | Division of Chemical, Bioengineering, Environmental, and Transport Systems (CBET)
- U54CA268084/HHS | NIH | National Cancer Institute (NCI)
- R01CA225002/HHS | NIH | National Cancer Institute (NCI)
- EFRI-1240416/NSF | ENG | Division of Emerging Frontiers and Multidisciplinary Activities (EFMA)
- R01 CA165309/CA/NCI NIH HHS/United States
- Searle Funds/Chicago Community Trust (CCT)
- Innovation Award/Lefkofsky Family Foundation (LFF)
- R01 CA155284/CA/NCI NIH HHS/United States
- T32AI083216/HHS | NIH | National Institute of General Medical Sciences (NIGMS)
- R01 CA225002/CA/NCI NIH HHS/United States
- U54CA193419/HHS | NIH | National Cancer Institute (NCI)
- U54 CA268084/CA/NCI NIH HHS/United States
- R01 CA228272/CA/NCI NIH HHS/United States
- U54 CA193419/CA/NCI NIH HHS/United States
LinkOut - more resources
Full Text Sources
Medical
